

Agricultural News
The US Safety Net, Crop Profitability, and a Floor on Cost of Production
Fri, 24 Jul 2020 07:29:44 CDT
 Taking a look at the latest issue of the farm doc daily from Illinois University, Carl Zulauf Department of Agricultural, Environmental and Development Economics Ohio State University, Gary Schnitkey Department of Agricultural and Consumer Economics University of Illinois, Michael Langemeier Center for Commercial Agriculture Purdue University write in the Gardner Policy Series on The US Safety Net, Crop Profitability, and a Floor on Cost of Production.
Since 1980, the US crop safety net has been countercyclical to aggregate net return for the 9 crops that USDA (US Department of Agriculture) reports cost of production (hereafter, COP). Payments have risen (declined) as aggregate market return fell below (rose above) aggregate COP for the 9 crops. The safety net thus creates a floor under aggregate cost of producing these crops, explaining why cash land rents have not declined despite the large decline in crop prices and returns since 2012.
Background
Measuring the farm safety net's impact on crop profitability is not straightforward. Many commodity programs, including ARC (Agriculture Risk Coverage) and PLC (Price Loss Coverage), pay on past, not current, acres planted to a program crop. Moreover, a farm does not have to plant the crop receiving a payment. Payment is thus to a farm, not a crop. However, past and current acres planted to program crops overlap notably. Using data from USDA FSA (Farm Service Agency) (2020c) and USDA NASS (National Agricultural Statistical Service) (2020), during the 2014 Farm Bill 85% of all acres planted to program crops were planted on historical base acres, 86% of base acres planted to a crop were planted to a program crop, and 98% of base acres and 98% of acres planted to program crops were 1 of the 9 COP crops. Even if the COP crop receiving a farm payment was not planted, one of the other 8 COP crops was most likely planted by the farm receiving the payment. Farm safety net payments are thus available to cover cost of producing COP crops as a group, implying the safety net's impact on profitability can be examined for the 9 COP crops as a group.
Overview of Data and Procedures
Since 1975, USDA ERS (Economic Research Service) has compiled COP for these 9 program crops: barley, corn, cotton, oats, peanuts, rice, sorghum, soybeans, and wheat. Returns are also computed using market price at harvest and yield. Total cost and market net return per planted acre for a crop are multiplied by US acres planted to the crop for the year. These values, along with safety net payments, are summed for the 9 COP crops for each year. A 3-year centered average of the ratio of aggregate net return, with and without safety net payments, to aggregate COP is calculated. For example, the ratio for 2017 is the average of the ratios for 2016, 2017, and 2018. This average dampens year-to-year variability while taking into account that farm payments may occur the next year. The appendix has more discussion of the data and procedures.
Safety Net Payments and Profitability
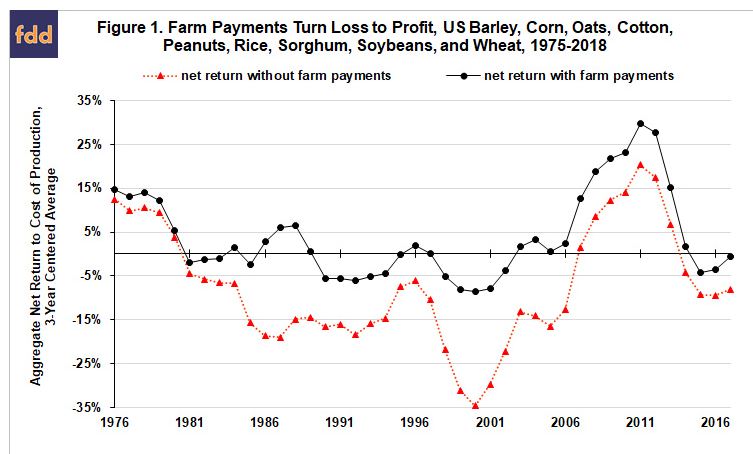
The 3-year centered ratio of aggregate net return for the 9 COP crops from the market at harvest (hereafter, market net return) is negative for 30 of 42 observations, including the 26 observations from 1981 to 2006 (see Figure 1). Average loss is -15% for the 30 negative observations. The largest loss is -35% (2000). Adding safety net payments to market net return changes the story. Observations with a loss drop to 18. The longest run of losses is 6 years (1990-1995). The average loss is -2%, and largest loss is -9% (2000). Note, USDA uses an economic measure of cost. Thus, it includes a wage payment to unpaid farm labor and a rent payment to owned land.
Across all years, safety net payments transform a -7% per year average aggregate market loss into a +4% per year average profit for the COP crops. And, farm payments are measured conservatively. Most ad hoc and emergency payments are not included since they cannot be identified by commodity.
Market net return was positive for 12 of the 42 observations, divided between two periods of prosperity: 1976-1980 and 2007-2013. Average market net return was 9% and 12%, respectively. Adding in farm payments resulted in much higher profits of 21% in the second period vs. 12% in the first period. In the 1970s, most farm programs were countercyclical; thus, payments were small. In contrast, during 2007-2013, the 9 COP crops received $4.8 billion per year in fixed, non-countercyclical payments.
2018 Payments Average in Size
Safety net payments for the 2018 COP crops totaled $13.6 billion, composed of $3.0 billion in ARC and PLC payments, $2.3 billion in net crop insurance payments, and $8.1 billion in MFP (Market Facilitation Program) payments. The latter offset losses from trade disruptions that followed the US imposition of tariffs on imports from targeted countries (American Farm Bureau). They turn a market net return loss for the 9 COP crops of -8% into a +2% profit. The 10 percentage point (pp) increase is slightly less than the average 13 pp average increase for years when a market loss occurs. On the other hand, farm payments turned a market loss into a profit in only 8 years prior to 2018.
2019 Payments High, but Not Highest
Safety net payments for 2019 are not final, but a reasonable estimate of $25.8 billion can be made. USDA Farmers.gov is currently reporting for non-specialty crops MFP payments of $13.6 billion and an estimate of $3.7 billion in CFAP (Coronavirus Food Assistance Program) payments. Most of these payments will go to the 9 COP crops. These crops have also received $5.4 billion in net insurance payments (USDA RMA) and are estimated to receive $3.0 billion in ARC / PLC payments (Congressional Budget Office). ARC / PLC payments are expected to be higher due to COVID-19 price declines. Aggregate COP and market net return loss for the 2019 COP crops total $128.7 and -$14.6 billion, respectively (USDA ERS). The estimated safety net payments turn the market loss into an $11.1 billion profit (- $14.6 + $25.8). Relative to COP, market loss of -11% (-$14.6 / $128.7) becomes a +9% profit (+$11.1 / $128.7). The 20 pp increase is the eighth largest. The largest is 30 pp in 1987. The +9% profit is the third highest among years with a market loss. It is exceeded only by 13% in 1987 and 11% in 1988. It is also interesting to note that net crop insurance plus ARC / PLC payments would have reduced the loss to -5% ((-$14.6 + $5.4 + $3.0) / $128.7). This loss is within the historical range of net returns with safety net payments, although it is toward the low end (see Figure 1).
Floor on Land Rent and Cost of Production
Strong evidence exists that crop safety net payments impact cash land rents (Kirwan and Roberts, and the literature reviewed therein). Because the COP crops are 80% of US principal crop acres (USDA NASS, 2020) and are profitable as a group after farm payments are included, it is not surprising that average US cash rent for cropland has rarely declined since this data became available in 1998 (USDA NASS, 2020) (see Figure 2). Using a 3-year centered average to be consistent with Figure 1, cash rent rose even in 1999-2002 when market net return was -20% or lower each year. Cash rent has declined from its high of $140/acre in 2014 and 2015, but by less than -2%. Figure 2 also contains cash rent deflated by the Gross Domestic Product Deflator. Base year, or the year equal to 100, for the GDP deflator is 2015. Inflation's impact on Figure 2 is generally marginal as it has been low since the late 1990s. The post-2013 decline is larger after adjusting for inflation, -7.7% vs. -1.7%. Note, US average cash rent for cropland is the focus of this discussion. Differences will exist by state. Also, other factors have supported land rents, including increasing productivity and low and generally declining interest rates since the late 1990s.
To read the rest of the article, and see the graphs that go with it, click here:
WebReadyTM Powered by WireReady® NSI
Top Agricultural News
More Headlines...