

Agricultural News
Latest Drought Monitor Map Shows Recent Ice Storm Dramatically Reduced Drought For Many Areas of Oklahoma and Kansas
Thu, 05 Nov 2020 15:18:37 CST
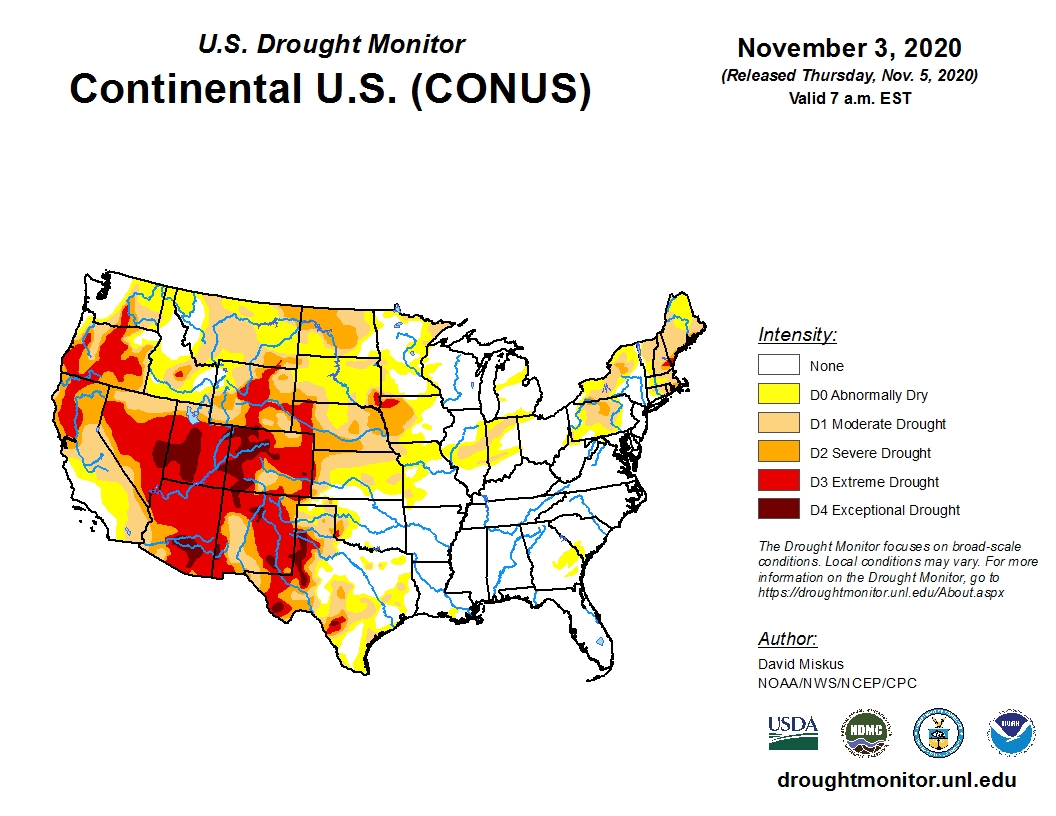
 Copious amounts of precipitation, some of it frozen, resulted in one and two category improvements for parts of Kansas, Texas and Oklahoma during this past week, according to the latest U.S. Drought monitor. This was particularly true in northwest and central Oklahoma where 3-5 inches fell.
West Texas, much of it in the Extreme (D3) to Exceptional (D4) Drought Category, received some light amounts and category improvement was minimal.
Little to no precipitation fell on the southern half of Texas for the second consecutive week. October is generally a wet month for that area but it has received less than 25 percent of normal during the last 30 days.
Southern Kansas, one of the dryer spots in the Plains, received 1-4 inches during this past week, leading to a full category improvement.
To view the U.S. Drought map, click here.
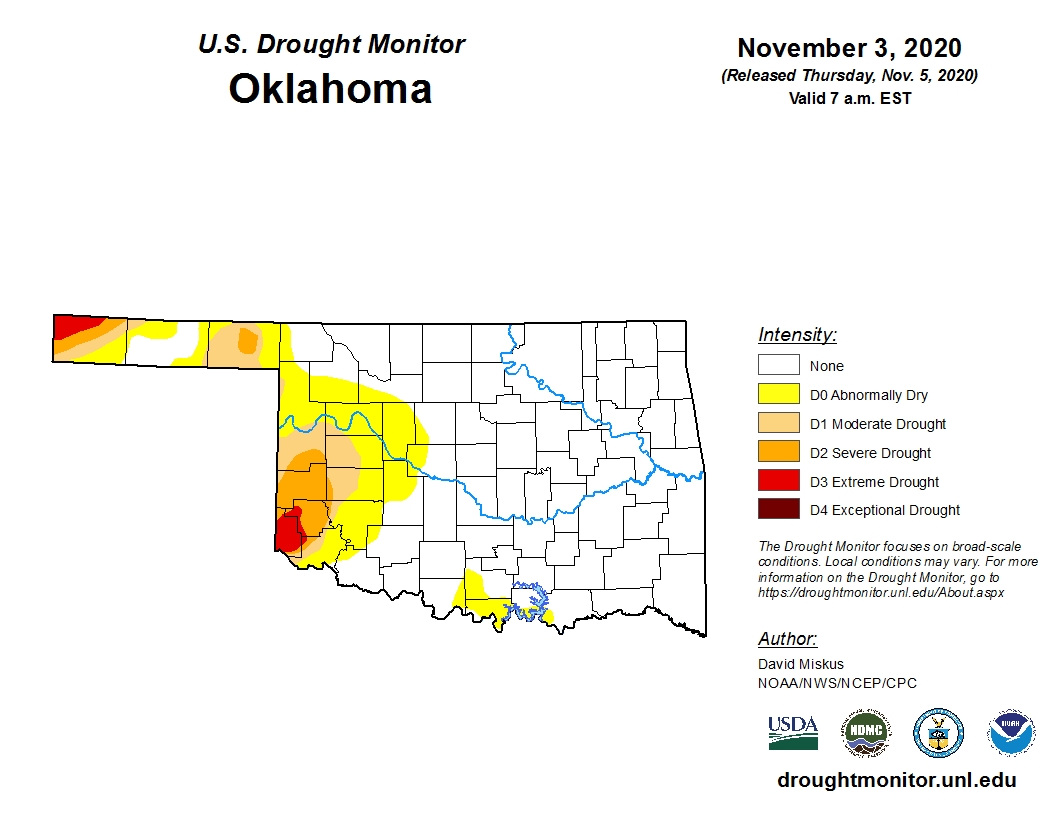
For Oklahoma, last week's storms brought a record ice event, leaving many without power. The moisture was welcomed by winter wheat producers but the damage from the ice storm will linger for months.
Statistically the precipitation made a huge difference on the drought map, going from 52 percent of the state covered in shades of drought to just 26 percent this week. It is difficult to remember a time this year where we have seen that much of a dramatic improvement in drought conditions in just one week.
Interestingly, at this time last year we were at about the same point with 24 percent of the state in drought.
Last week we had 3.61 percent of the state in Extreme Drought but after the storms, there is only 1.44 percent of the state covered in D3. Most of the D3 can still be found in Cimarron and Harmon Counties.
To view the Oklahoma drought map, click here.
Looking ahead, there is more seasonal weather on the forecast maps.
To view the 6-10-day temperature outlook, click here.
To view the 6-10-day precipitation outlook, click here.
Keep in mind La Nina has arrived and that does not bode well for much long-term relief.
To view the monthly drought outlook map for November, click here.
Looking farther down the road towards the end of the year into 2021, click here for the Dec. -Jan. 2021 precipitation outlook.
The U.S. Drought Monitor Map is developed through a partnership between the National Drought Mitigation Center at the University of Nebraska-Lincoln, the United States Department of Agriculture, and the National Oceanic and Atmospheric Administration.
WebReadyTM Powered by WireReady® NSI
Top Agricultural News
More Headlines...


