

Agricultural News
Latest U.S. Drought Map Shows Some Improvement But Southwest Still Suffering
Thu, 24 Dec 2020 08:48:12 CST
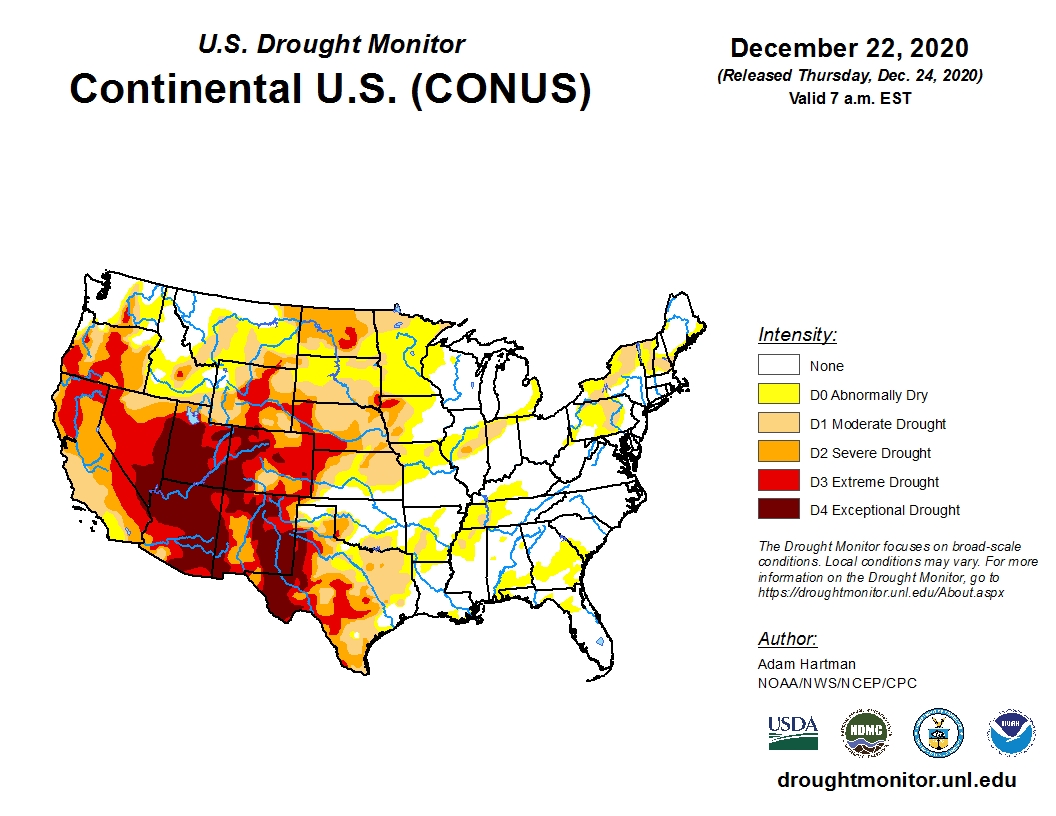
 Typically during La Nina years we see storms pushed north across the western U.S. leading to above normal precipitation and snowpack in the Pacific Northwest and northern Rockies, and below normal southward.
That storyline was followed during this past week as western and central Texas saw some degradation in drought areas, with a lack of precipitation (less than 10 percent of normal in the last 90 days).
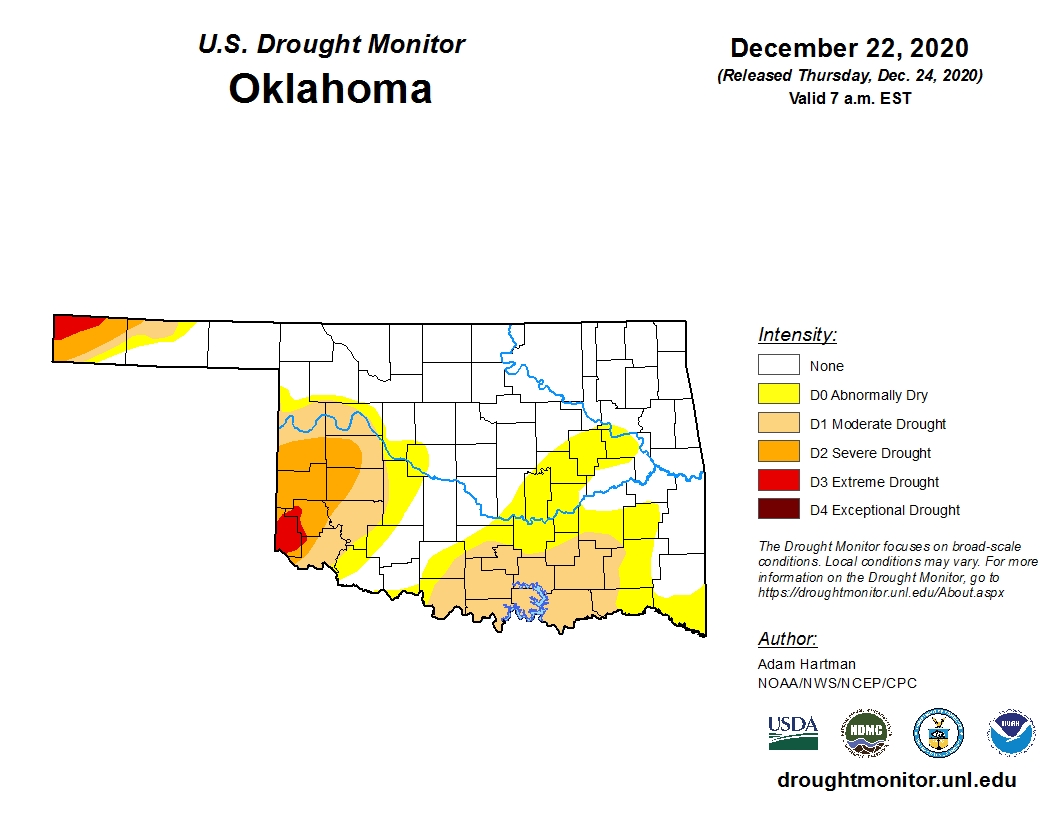
There was some minor trimming of abnormally dry (D0) category in north central Oklahoma after .25 to .50 inches of precipitation fell last week.
To view the U.S. Drought map, click here.
For Oklahoma, a relatively quiet week statewide, except for the strong winds, we have noted a slight improvement as almost 57 percent of the state is drought free, compared with 54 percent last week.
Two areas of concern continue to color the map: Cimarron County in the Panhandle and Harmon County in the southwest corner of the state which both show shades of red for extreme drought (D3).
To view the Oklahoma drought map, click here.
To view the monthly drought outlook map for December from the Climate Prediction Center, click here.
The outlook for New Years will be cool and wet, hopefully leading to a further reduction in drought coverage.
To view the 6-10-day temperature outlook, click here.
To view the 6-10-day precipitation outlook, click here.
The U.S. Drought Monitor Map is developed through a partnership between the National Drought Mitigation Center at the University of Nebraska-Lincoln, the United States Department of Agriculture, and the National Oceanic and Atmospheric Administration.
WebReadyTM Powered by WireReady® NSI
Top Agricultural News
More Headlines...


