

Thu, 20 Oct 2022 11:08:48 CDT
According to the Oklahoma Mesonet, the November- January outlook shows above-normal temperatures through the state, but below-normal precipitation for all but the far northeast. Drought is expected to persist throughout the state.
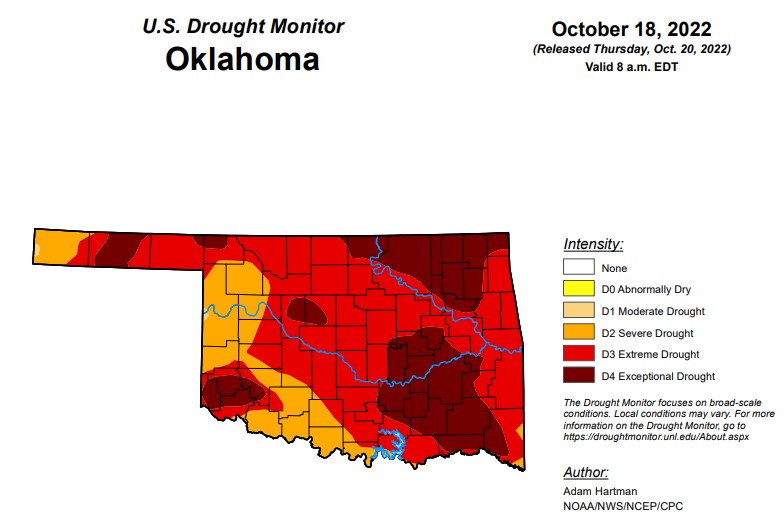
In Oklahoma, exceptional drought is at 29.7 percent, up significantly from last week’s 29.1 percent.
Extreme drought or worse is now at 82.2, down from last week’s 85.6 percent.
Severe drought or worse is up to 99.8 percent, up slightly from last week's 99.6 percent.
Moderate drought or worse is up to 100 percent, unchanged from last week.
Abnormally dry or worse conditions remain at 100 percent.
According to the 6-10-day precipitation outlook map for Oklahoma through October 29, the eastern part of the state is leaning above a 33-40 percent chance of precipitation and the western part of the state is leaning below a 33-40 percent chance of precipitation. The central part of the state is showing near-normal chances of precipitation.
To view the Oklahoma Drought Map, click here.
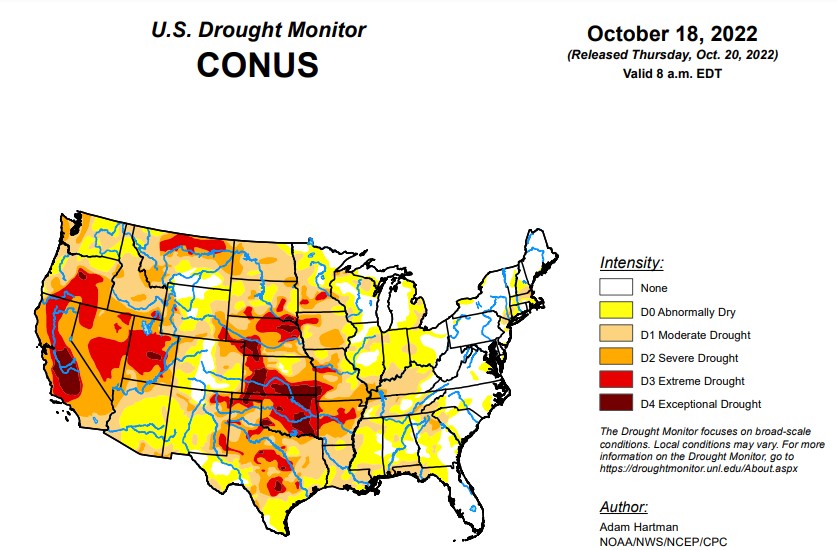
According to the latest U.S Drought Monitor Report, much of the western half of the lower 48 states observed above-normal average temperatures this week. The Intermountain West and Pacific Northwest experienced the largest positive temperature anomalies, where widespread temperatures averaged 5°F to 10°F above-normal, with a few pockets exceeding 10°F above-normal for the week as whole. In addition to the above-normal temperatures, precipitation was also lacking for most areas from the Central and Northern Plains westward to the Pacific Coast, warranting drought deterioration. Parts of the Four Corners and Desert Southwest were the exception to this, as an area of low pressure meandered across the Southwest before being picked up by a frontal boundary dropping southward across the central U.S. This resulted in improvements to long-term drought conditions across parts of the Four Corners, with targeted improvements in the Southern Plains. Across the eastern half of the lower 48, frontal boundaries associated with a couple of strong low pressure systems in the Great Lakes brought heavy precipitation and cooler than normal temperatures to portions of the Great Lakes, Northeast, and Southeast. Therefore, a widespread mix of improvements and deterioration was warranted in many locations where the heaviest precipitation did and did not fall, respectively.
To view the United States Drought Monitor Report, click here.
In the Southern Plains, frontal boundaries associated with a couple of strong low pressure systems over the Great Lakes brought heavy precipitation to parts of the Red River Valley of the South, the Ozarks, and the Tennessee Valley this week. Farther westward toward the Rio Grande Valley, a cutoff low pressure system became entrained into the second frontal boundary dropping southward across the central U.S. bringing heavy rainfall to parts of western and southern Texas. Improvements were generally warranted in areas receiving the heaviest rainfall (greater than 1 inch positive 7-day anomalies). However, antecedent 30-day dryness resulted in status quo depictions for several other locations receiving near to above-normal rainfall, as surface soil moisture has rapidly declined due to widespread 3 to 5 inch 30-day precipitation deficits and predominantly above-normal temperatures. This dryness also extends to 60 to 90 days for several areas across the Southern Plains and along the Gulf Coast, warranting 1-category deteriorations in the drought depiction for many locations not receiving rainfall this week.
In the High Plains, Region observing near to below-normal average temperatures this week, a combination of antecedent dryness, below-normal precipitation, and high winds resulted predominantly in continued degradation region-wide. The only exception was the southwestern corner of Colorado, where short and long-term drought indicators have shown continued improvement following a robust Southwest Monsoon season and a couple of additional episodes of precipitation, associated with cutoff areas of low pressure in the Southwest in recent weeks.
In the West, An upper-level low pressure system, coupled with a frontal boundary dropping southward across the central U.S. resulted in a good soaking this week for many areas from southeastern California eastward to the Rio Grande Valley. Given the lingering precipitation associated with this area of low pressure following the climatological end to a very robust Southwest Monsoon season in late September, this was another much-needed round of precipitation to further fuel ongoing improvements to long-term drought indicators, such as groundwater and 12 to 24-month SPIs. Soil moisture is in excellent shape as well coming out of the monsoon season across Arizona and New Mexico. Farther northward in the Western Region, degradation was the main story, as below-normal precipitation and above-normal average temperatures (in some cases record high temperatures for this time of year) were observed. High winds and above-normal temperatures resulted in targeted degradations across northern portions of the Intermountain West and the High Plains. In the Pacific Northwest, degradations were also warranted, with the addition of D2 (severe drought) across the parts of the Coastal Ranges and Northern Cascades in Washington, where 28-day average stream flows have dropped into the bottom 2 percent of the historical distribution. In addition, soil moisture ranks in the bottom 5 percent climatologically, vegetation indices are indicating widespread drought stress, groundwater levels are falling, and SPIs for all periods out to 120 days are D4-equivalent (exceptional drought). The Pacific Northwest is entering into a climatologically wetter time of year, so precipitation will need to come soon to halt further deterioration.
Looking ahead, during the next five days (October 20-24), the storm system over the Great Lakes is forecast to move northeastward into Canada, but bring some additional light precipitation to parts of the northern and eastern Great Lakes. Surface high pressure is expected to dominate much of the eastern lower 48. However, a storm system is predicted to spin up off the coast of the Carolinas bringing the potential for rainfall along portions of the Eastern Seaboard. In the West, an active storm pattern is expected, with the potential for upwards of 3 inches of precipitation for the higher elevations of the Pacific Northwest and upwards of 2 inches across portions of the Intermountain West. The first of two systems is expected to intensify over the central U.S. leading up to October 24, bringing increased precipitation chances to much of the Great Plains and the Mississippi Valley. Below-normal temperatures are expected to shift eastward from the West Coast to the Great Plains, associated with the storm system entering the West during the weekend. Ahead of this system, southerly flow is expected to keep temperatures near and above-normal, with the largest anomalies shifting eastward from the Great Plains to the eastern U.S.
The Climate Prediction Center’s 6-10 day outlook (valid October 25-29), predicts increased chances of below-normal temperatures for southeastern Alaska and the western half of the contiguous U.S. (CONUS). Southerly flow and above-normal temperatures are favored from the Mississippi Valley to the East Coast. An active storm track is forecast across the Northeast Pacific, leading to above-normal precipitation odds across much of Alaska and extending into the Pacific Northwest. Low pressure is forecast to develop east of the Rockies bringing the potential for above-normal precipitation to much of the southeastern CONUS. Conversely, in the Southwest, below-normal precipitation is favored as the storm track is expected to remain farther northward.
To view the 6-10 Day Precipitation Outlook Map, click here.
To view the 6-10 Day Temperature Outlook Map, click here.
To view the Monthly Drought Outlook Map, click here.


