In late August I was at a farm show in Iowa when a customer walked up to me. “Al,” he said, “two years ago, when I drove down to the farm show, one bushel of corn would buy 2 gallons of gas. Last year it bought a gallon and a half. This year not even a gallon! What will turn things around?”
I told him to sit in on my presentation and that we should talk after the program. Maybe I could answer his question.
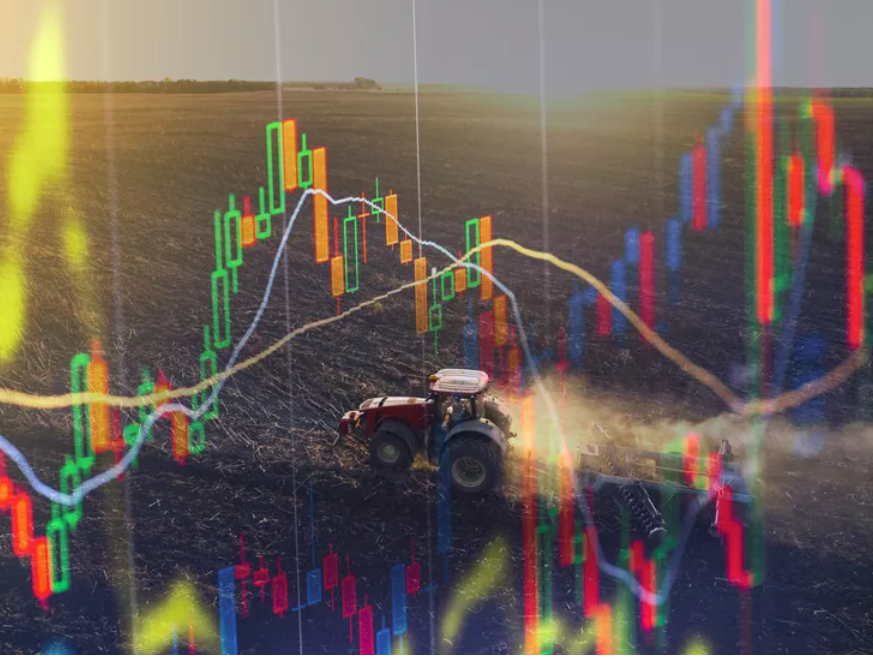
:max_bytes(150000):strip_icc():format(webp)/Internationalperceivedpriceforcornmonthly-f6ca1ba52e794efa9e572b1dd044ad7e.png)
First, what got us here?
Let’s start with the USDA monthly reports we follow with our webinars. In particular let’s look at how much grain is on hand around the world — the global “ending stocks.”
Over the last two years, we’ve witnessed a dramatic change in global ending stocks. In August the USDA projected global corn ending stocks to be 310 million metric tons (mmt) compared with 303 mmt just two years ago. For soybeans the USDA projects ending stocks to grow to 134 mmt compared with just 101 mmt two years ago.
The fundamentals always look the worst at major lows. The good news is today’s lower CBOT futures price has built in those large numbers.
The second factor that has driven down prices is U.S. crops’ excellent 2024 production conditions. Week by week we had nearly ideal growing conditions across most of the Corn Belt. Each week the USDA reported high crop ratings. This had the agency projecting record yields by late summer.
This fits with the long-term monthly corn and soybean continuation charts I study: They project a major low in 2024 or the first quarter of 2025. We had the classic end-of-February low the last week of February 2024, followed by a weather rally into May 17. From those high futures prices for corn and soybeans, prices turned lower, then continued lower. My research shows that in this scenario, prices often put in a major low in October. Watch for a low during the World Series or when the U.S. harvest reaches just beyond 50% complete.
When this large crop is put away, I expect rapid basis improvement and, eventually, futures prices to turn higher.
Why? Because they are so very, very low, especially for overseas buyers. One chart I build factors in the U.S. dollar’s changing value; this allows me to chart what I call the “international perceived price” for corn and soybeans. At this time international corn and soybean prices are their lowest since fall 2020 and approaching the lowest prices since 2009.
These charts show that global grain buyers are paying bargain basement prices. The U.S. is competitive with offers out of South America.
Another way I look at prices is to compute purchasing power, which I call “the real price.” I build a chart that uses the inflation-adjusted dollar.
Farmers are very aware of inflation this fall, since input costs are up 5% to 10%. When you sell crops in 2024, the dollars you get are worth only about 80% of what they were in 2020. If you go all the way back to 2009, the purchasing power of the dollars you generate today are worth about 70%. The last time the “real prices” were this low was 1968 through 1972. Compared with that period, farms are a lot larger and yields have improved. But still … you have to have real money to pay your bills.
Now that I have laid out all these negative economic facts, I will try to show you three signals to know when the trend has changed.
:max_bytes(150000):strip_icc():format(webp)/internationalperceivedpriceforsoybeansmonthly-f7d649783eaf48c2806f1bd265cce59a.png)
1) Watch central Illinois cash basis bids. Illinois is projected to have a record corn crop in 2024. The cash and futures markets have built in huge carrying charges. Odds are good that by late October, basis bids will start to improve. That is when U.S. processors will scramble to lock in the lowest input cost.
2) Watch for when the futures markets’ large carrying charges start pulling in. At this time the December-to-July corn futures market price spread is 37¢. I think it can get as wide as 40¢. When that spread starts narrowing, then it’s a positive sign for prices. The November-to-July soybean spread is 58¢; I think it can get to 62¢ to 65¢. Watch in late October to see whether the soybean spread starts narrowing.
3) Watch for the first monthly higher close in the nearby futures market. Since May, corn and soybean futures have been in a grinding bear market, with corn futures down over $1.00 per bushel, and soybean futures down over $4.00 per bushel. When the down-trend is over, I anticipate a basing-type market. But watch for the first monthly higher close you see posted on the long-term monthly corn and soybean charts.
Now, back to the question “What will turn prices around?”
First, it takes time to build back into a demand-driven market. However, as fast as the world fundamentals have turned bearish, they can turn back to bullish within the next two years.
Second, price eventually does work. Farmers around the world will be reducing inputs, since new crop prices are below the cost of production. This does not always take yields lower, but it sets up more variable yields next year. With lower prices, expect usage projections to start to improve.
Some Final Thoughts:
The odds are good that prices will put in major lows by the end of October. I think it is important to be realistic in the price objectives you make for selling your 2024 crops. Just because prices have put in major lows and start to turn around does not mean we are right back to $6 corn and $15 soybeans.
When I look back at the other major lows, you usually get a minimum 30¢ rally in corn. Sometime next year that rally and the 40¢ carry in the corn market should set up cash prices 60¢ to 80¢ higher than the October low. For soybeans a 60¢ rally in the futures market and 50¢ to 60¢ carry sets up a rally of $1.00 to $1.20 per bushel. With good yields this year, set up a revenue plan that works for your farm.
Note: The risk of loss in trading futures and/or options is substantial, and each investor and/or trader must consider whether this is a suitable investment. Past performance — whether actual or indicated by simulated historical tests of strategies — is not indicative of future results. Trading advice reflects good-faith judgment at a specific time and is subject to change without notice. There is no guarantee that the advice given will result in profitable trades.
Article Courtesy of Successful Farming