

PORTFOLIO PERFORMANCE, DIVERSIFICATION, AND STRATEGY
January portfolio yielded 3.59%, up from 3.12% last year, with a weighted average maturity of 826 days.
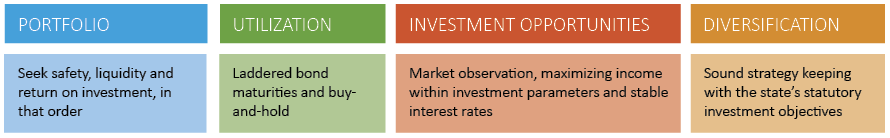
Total assets under management of $17.9 billion, up $1.7 billion in comparison to January 2024.
Total portfolio contained 66.1% in U.S. Treasurys, 2.7% in U.S. government agencies, 11.8% in mortgage-backed securities, 18.5% money market mutual funds, 0.2% in certificates of deposit, and 0.8% in state bond issues and foreign bonds, comprising the balance of funds invested.
“Total portfolio yields are lower than current yields due to the laddered structure of the investments over a 3-year average.” STATE TREASURER, TODD RUSS
TOTAL FUNDS INVESTED
Funds available for investment at market value include the State Treasurer’s investments at $12,626,821,663 and State Agency balances in OK Invest at $3,303,889,812, American Rescue Plan investments at $1,139,214,945, and the Oklahoma Capitol Improvement Authority Legacy Fund at $795,909,153 for a total of $17,865,835,573.
MARKET CONDITIONS

In January the 2-year and 10-year treasury notes fell 0.04% and 0.03% respectively to 4.20% and 4.54%. Treasury yields were mixed and essentially unchanged for the month as the Fed left their target rates unchanged. In January the S&P 500, Dow Jones, and Nasdaq have posted respective monthly gains of 2.7%, 4.7%, and 1.6%.
The Fed maintained its target range at the January 29th meeting. Federal Reserve Chair Jerome Powell told members of the Senate Banking Committee, “We’re in a pretty good place with this economy. We want to make more progress on inflation. And we think our policy rate is in a good place, and we don’t see any reason to be in a hurry to reduce it further”. With marginally increasing inflation and a strong labor market, rate cuts in the near future are unlikely. Consensus forecasts two quarter-point rate cuts this year, one in September and another in December while the Fed enters a ‘wait and see’ period until new economic data supports a decision supporting maximum employment and returning inflation to its 2% objective.
ECONOMIC DEVELOPMENTS
In January, unemployment fell to 4.0% from 4.1% in December. According to the Bureau of Labor Statistics, total non-farm payroll employment increased by 143,000 jobs in January, coming in below consensus expectations of 175,000 jobs. Employment trended up in the health care, retail trade, and social assistance job markets. Employment declined in the mining, quarrying, and the oil and gas extraction industry.
The consumer price index (CPI) rose 0.5% in January and 3.0% for the year. The Bureau of Labor Statistics writes, “the index for shelter rose 0.4% in January account for nearly 30% of the monthly all items increase”. Core personal consumption expenditures (PCE), the Fed’s preferred measure of inflation increased 2.5% in Q4. The producer price index (PPI) increased 0.4% in January. The index for final demand services led growth and increased 0.3% and prices for final demand goods moved up 0.6%. The Bureau of Labor Statistics writes, the increase, “over one-third of the January rise in the index for final demand services can be traced to prices for traveler accommodation services, which advanced 5.7%”.
Retail sales adjusted for seasonal variation fell 0.9% in January and revised up to 0.7% for December. This month came in below expectations down 0.2%, according to the Wall Street Journal. A component of the surprise drop was the unexpected upward revision of December retail sales. Analysts believe that cold weather could have depressed spending by staying home but online sales fell 1.9% and restaurant sales were up 0.9%. Aside from the January retail sales data, there are no other significant signs of consumer stress, so retail sales are expected to rebound.
In December, the National Association of Realtors reported that existing home sales increased 2.2% to a seasonally adjusted annual rate of 4.24 million homes, up 9.3% from last year. Total housing inventory fell to 1.15 million, the equivalent of 3.1-month supply at the current sales pace. At the end of December, the average 30-year fixed rate mortgage was 6.95%, up 3.9% from a year ago. The median existing home sales price in December was $409,300, up 6.1% from last year.
The U.S. economy, measured by real GDP, expanded at a 2.3% annualized rate in Q4. Growth was held back by a slower stockpiling in inventories, but boosted by solid consumer spending, both of which may partially reflect a pull forward in demand ahead of potential tariffs. Tariff policy is at the front of economist interpretation of economic activity and will have an unknown final effect on imports and inventories. The Bureau of Economic Analysis writes, “the increase in real GDP in the fourth quarter primarily reflected increases in consumer spending and government spending that were partly offset by a decrease in investment. Imports, which are a subtraction in the calculation of GDP, decreased.”
COLLATERALIZATION
All funds under the control of this office requiring collateralization were secured at rates ranging from 100% to 110%, depending on the type of investment.
Best regards,

TODD RUSS
STATE TREASURER
View full report below.