
The U.S. Department of Agriculture (USDA) today released its latest World Agricultural Supply and Demand Estimates (WASDE) and Crop Production reports, indicating a slightly bullish sentiment for corn and wheat, while maintaining a neutral stance on soybeans. Key adjustments include increased old-crop corn exports and subsequent reductions in ending stocks for both old- and new-crop corn.
The agricultural community is sifting through the details of today’s World Agricultural Supply and Demand Estimates (WASDE) report, released by the USDA. Farm Director KC Sheperd spoke with Rich Nelson of Allendale to break down the numbers, which primarily focused on old-crop adjustments and a conservative approach to new-crop production figures.
“You’ll see the monthly supply demand report, and that does hold adjustments to old crop as well as new crop numbers,” explained Nelson. He noted that while there’s significant interest in new-crop corn and soybean yields and production, the USDA often makes no changes to production figures in this early-year report, a pattern observed again this month.
Wheat: Modest Movement and Quality Concerns
Wheat saw some “moderate movement” in the report. With the old crop year for wheat concluding on May 31st, final stock numbers are pending the quarterly grain stocks report at the end of the month. On the new-crop side, while the USDA considers the wheat balance sheet “live” for this report, total wheat production was left unchanged. Nelson pointed out “minuscule changes to hard red down 2 million bushels from last month [and] they did raise white, but overall numbers, no change.”
A crucial point for wheat, as Nelson emphasized, is the distinction between quantity and quality. “There’s no change in production, which is quantity. Still a lot of questions about quality for the hard red and also soft red crops as well.” Despite these concerns, the USDA reported strong export sales for wheat, resulting in a decline in stock numbers to 825 million bushels, which Nelson described as “good news overall there.”
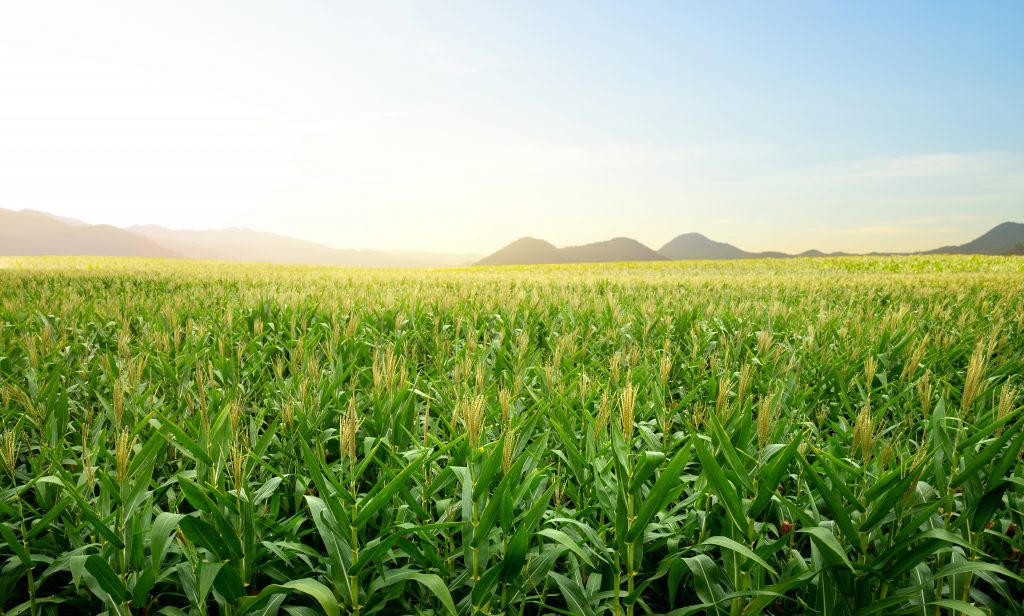
Corn: Exports Drive Down Ending Stocks
For corn, the USDA acknowledged robust export activity, adding 50 million bushels to their prior whole-year estimate for old-crop. “Therefore, we have ending stocks now dropping below 1.4 billion bushels, now 1.365 [billion bushels] in fact,” Nelson stated. This old-crop adjustment directly influenced the new-crop numbers, with no changes in new-crop production, reflecting a routine conservative approach. New-crop ending stocks for corn are now projected at 1.750 billion bushels.
Soybeans: Unchanged Amid Trade Uncertainty
In the soybean sector, the report brought no changes to any of the USDA’s old-crop or new-crop numbers. “Old crop stock still left at 350 [million bushels], new crop, which is still a big question given all of our trade concerns, 295 million bushels for new crop stocks,” Nelson highlighted. The ongoing trade relations, particularly with China, remain a significant unknown for the soybean market.
Report Theme: Cautiously Positive, Export-Driven
Nelson characterized the overall theme of the report as “certainly a little positive,” primarily due to the USDA’s continued reflection of strong export figures for corn and wheat. He even suggested that “a lot of people, including ourselves, suggest that there will be another change there as well, another increase for corn exports, probably on this next report, same kind of story for wheat.” He highlighted the “The best new crop bookings for exports in 12 years” for wheat, which began on June 1st.
However, soybeans remain a source of uncertainty. “Still a lot of questions, and certainly, as it stands right now, we don’t quite have the US-China relations fixed either. So there are still a lot of questions with soybeans specifically,” Nelson said, addressing the ongoing tariff situation. He explained that the USDA is taking a “very conservative approach,” not factoring in potential tariff changes until they are officially implemented.
Weather’s Impact: Quality Over Quantity, For Now
The conversation also touched on the significant weather events, particularly the extensive rain across the Midwest and Oklahoma, following drought conditions in Texas that impacted wheat. Nelson clarified that the full impact of these conditions on production numbers might not be seen immediately. “You may wait until this crop is more or less harvested… And the second issue is, maybe they won’t really hit the production numbers quantity. Maybe their discussion will be, is probably more of a quality issue.” If quality issues prevent crops from being exported or used as consumer products, they might be “pushed through the feed residual category,” which the USDA will likely address in the coming months.
Cotton and Livestock Updates
In cotton, the USDA made some adjustments. While planted acreage remained unchanged, harvested acres decreased by 200,000, and the yield estimate was also lowered. “They did drop about a half million bales out of their number now, 14.0 [million bales],” Nelson stated, adding that this is “lower than last year, but not as bad as the numbers from two years ago.” This helped to drop ending stock numbers to 4.3 million bales, now “under last year.” Concerns about planting cotton in Oklahoma due to excessive moisture indicate that this is still a “very live and early part of the season for the cotton side.”
For livestock, the report saw a reduction of about 65 million pounds in this year’s beef production estimate from last month, although it remains a “light decline from last year down 2.4%.” Nelson noted that while this was a “positive change on the production side,” increased imports offset it, resulting in a “net increase” in beef available to the U.S. consumer. Pork production is projected to increase by 0.7% from last year, with moderate changes in imports and exports resulting in a “light net increase in the amount of pork left for the US consumer.”
Looking Ahead to July’s Report
Nelson anticipates “a little more interest” in next month’s report. For wheat, there might be “a light change here on the yield side” as the USDA addresses the “quality versus quantity issue for hard red and soft red.” He also expects “another increase for wheat export sales.” For corn and soybeans, the July report is when the USDA typically becomes “a little more active in changing yields,” though Nelson isn’t sure they’ll “really be playing with yields too much” just yet. The uncertainty surrounding U.S.-China relations suggests the USDA might again “pass the buck… from making changes on the export side” for soybeans.
For those with further questions, Rich Nelson can be reached at 1-800-2-MARKET or through their website, allendalehub.com.
You can also view the full reports here:
— Crop Production: https://www.nass.usda.gov/…
— World Agricultural Supply and Demand Estimates (WASDE): http://www.usda.gov/…
| U.S. PRODUCTION (Million Bushels) 2025-26 | ||||||
| Jun | Avg | High | Low | May | 2024-25 | |
| Corn | 15,820 | 15,795 | 15,820 | 15,525 | 15,820 | 14,867 |
| Soybeans | 4,340 | 4,338 | 4,340 | 4,300 | 4,340 | 4,366 |
| All Wheat | 1,921 | 1,923 | 1,949 | 1,891 | 1,921 | 1,971 |
| Winter | 1,382 | 1,386 | 1,410 | 1,347 | 1,382 | 1,349 |
| HRW | 782 | 789 | 800 | 768 | 784 | 770 |
| SRW | 345 | 347 | 355 | 340 | 345 | 342 |
| White | 254 | 252 | 256 | 247 | 253 | 236 |
| U.S. ENDING STOCKS (Million Bushels) 2024-25 | ||||||
| Jun | Avg | High | Low | May | ||
| Corn | 1,365 | 1,386 | 1,450 | 1,315 | 1,415 | |
| Soybeans | 350 | 352 | 382 | 340 | 350 | |
| Wheat | 841 | 840 | 866 | 816 | 841 | |
| U.S. ENDING STOCKS (Million Bushels) 2025-26 | ||||||
| Jun | Avg | High | Low | May | ||
| Corn | 1,750 | 1,792 | 2,136 | 1,655 | 1,800 | |
| Soybeans | 295 | 302 | 394 | 285 | 295 | |
| Wheat | 898 | 916 | 948 | 868 | 923 | |
| WORLD ENDING STOCKS (million metric tons) 2024-25 | ||||||
| Jun | Avg | High | Low | May | ||
| Corn | 285.0 | 288.1 | 295.0 | 285.0 | 287.3 | |
| Soybeans | 124.2 | 123.1 | 124.2 | 122.0 | 123.2 | |
| Wheat | 264.0 | 265.2 | 266.0 | 264.3 | 265.2 | |
| WORLD ENDING STOCKS (million metric tons) 2025-26 | ||||||
| Jun | Avg | High | Low | May | ||
| Corn | 275.2 | 278.9 | 285.0 | 275.0 | 277.8 | |
| Soybeans | 125.3 | 124.6 | 126.0 | 123.4 | 124.3 | |
| Wheat | 262.8 | 265.1 | 270.0 | 254.9 | 265.7 | |
| WORLD PRODUCTION (million metric tons) 2024-25 | ||||||
| Jun | Avg | High | Low | May | ||
| CORN | ||||||
| Argentina | 50.0 | 49.9 | 51.0 | 49.0 | 50.0 | |
| Brazil | 130.0 | 131.5 | 135.0 | 129.0 | 130.0 | |
| SOYBEANS | ||||||
| Argentina | 49.0 | 49.0 | 50.0 | 48.0 | 49.0 | |
| Brazil | 169.0 | 169.2 | 171.0 | 168.3 | 169.0 | |