
To view the latest Oklahoma drought map, CLICK HERE.
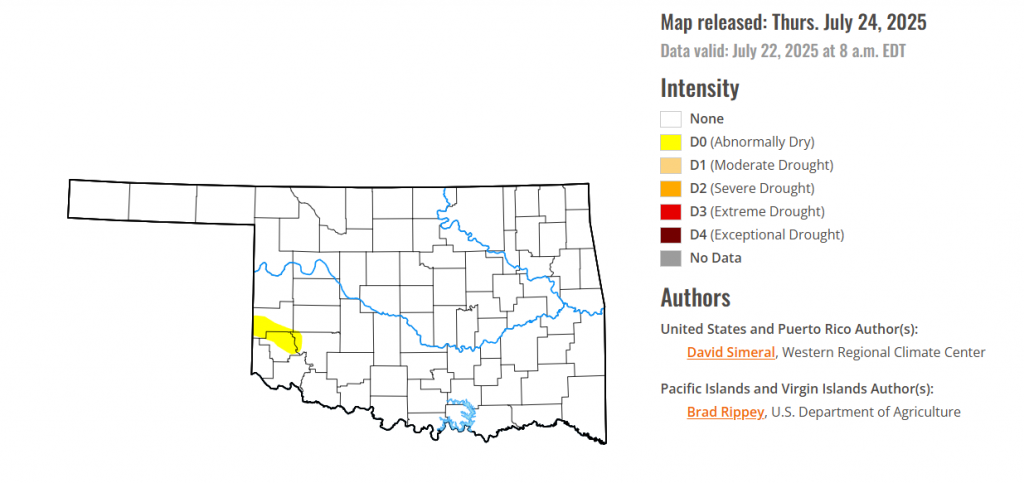
According to the latest Oklahoma drought monitor report, exceptional drought remains at zero percent, unchanged from the start of the calendar year.
Extreme drought or worse conditions remain at zero percent, unchanged since the week of October 29, 2024.
Severe drought or worse conditions remain at zero percent, unchanged since the week of May 29, 2025.
Moderate drought or worse conditions remain at zero percent, unchanged since last week.
Abnormally dry or worse conditions have persisted this week in parts of Greer county, Beckham county and Kiowa county.
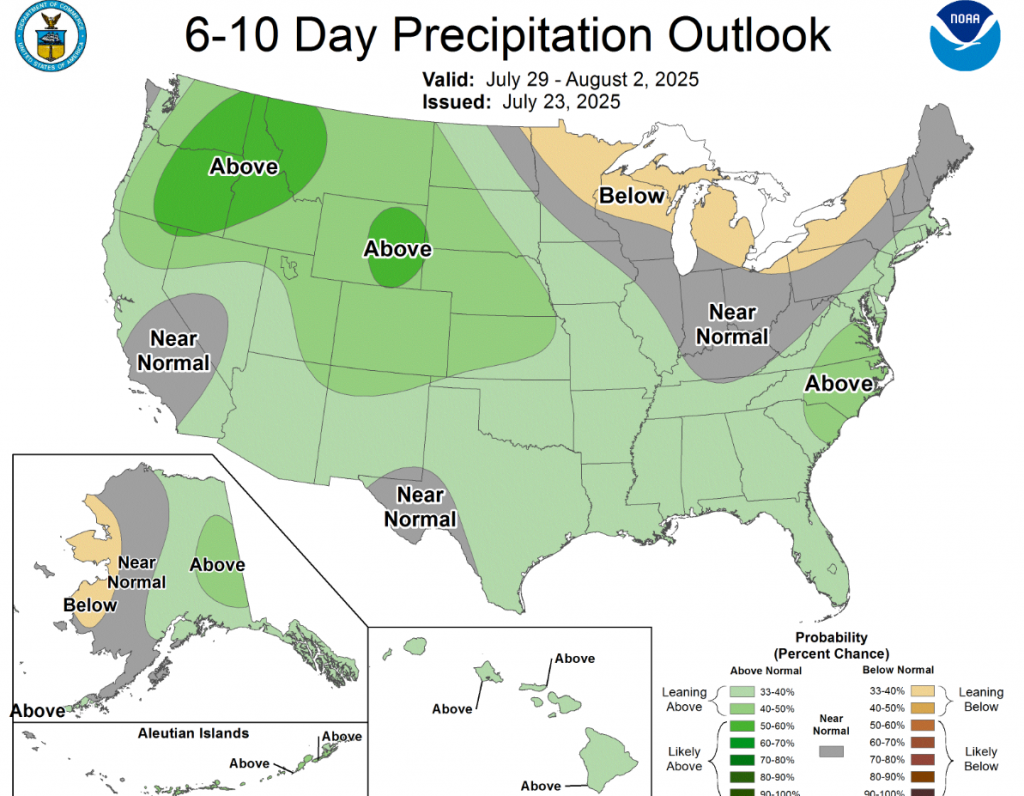
According to the 6-to-10-day precipitation outlook map, most of the state of Oklahoma is leaning above 33-40% chance of precipitation through August 2, while the very northwestern most part panhandle is leaning above 40-50% chance during that same date.
To view the United States Drought Map, CLICK HERE.
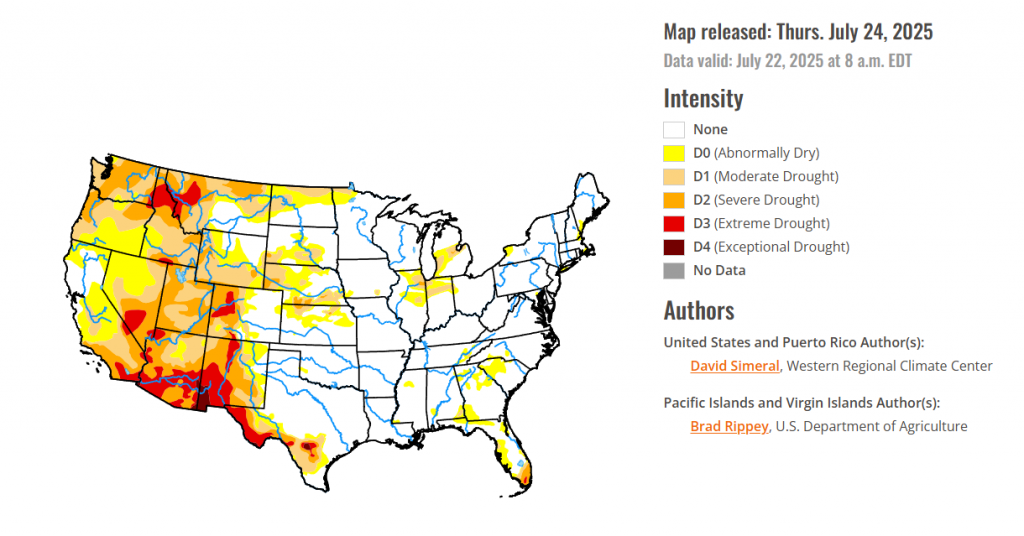
This U.S. Drought Monitor (USDM) week saw improvement in drought-related conditions across areas of the Southeast, South, Midwest, central and northern Plains, Intermountain West, and Desert Southwest, where short-term precipitation accumulations (past 30-day period) have helped to improve drought-related conditions. For the week, the most significant rainfall accumulations were observed across northern Kansas and areas of the Midwest including Missouri, Iowa, Illinois, and Indiana where accumulations ranged from 3 to 10+ inches, with the highest accumulations observed in northeastern Kansas. On the map, improving conditions over the past 30 to 60 days led to reduction in areas of drought in the Plains states, Kansas to North Dakota, as well as across drought-affected areas across the Midwest. Elsewhere, short-term dryness led to widespread expansion of areas of Abnormally Dry (D0) across the Southeast states including the Carolinas, Georgia, Alabama, and the Florida Panhandle. In the South, drought conditions continued to improve in Texas, including in the Trans-Pecos region in western Texas where short and mid-term composite drought indicators are showing improving conditions in terms of precipitation, soil moisture, and vegetation health. In the West, conditions were generally dry regionally, however, some isolated monsoon thunderstorms provided a much-needed boost in moisture (2 to 3 inch accumulations during the past week) to drought-affected areas of east-central and southeastern Arizona as well as lesser accumulations observed in central and northern Arizona. In terms of reservoir storage in the West, California’s reservoirs continue to be at or above historical averages for the date (July 22), with the state’s two largest reservoirs, Lake Shasta and Lake Oroville, at 105% and 117% of average, respectively. In the Southwest, the U.S. Bureau of Reclamation is reporting (July 21) Lake Powell at 31% full (47% of average for the date), Lake Mead at 31% full (52%), and the total Colorado system (July 20) at 39% of capacity (compared to 45% of capacity the same time last year).
In the Hawaiian Islands, rainfall during the past week led to improvements on the map in Maui, Oahu, and Kauai. Rainfall was mainly concentrated in the higher elevations on the windward slopes with the highest weekly total logged in Kauai (17 inches at the Mount Waialeale station).
In Alaska, improving conditions led to the removal of the three areas of Moderate Drought (D1) as well as reductions in areas of Abnormally Dry (D0).
Puerto Rico, a mix of minor improvements and degradations were made on the map this week.
In the south, On this week’s map, improvements were made in the Hill Country and Trans-Pecos regions of Texas in response to improving conditions during the past 30-90 days. In these regions, targeted improvements were made in all drought categories (D1-D4). In Tennessee, a mix of degradations and improvements were made on the map in isolated areas of central and eastern Tennessee. For the week, average temperatures were generally above normal in eastern areas of the region, with anomalies ranging from 2 to 8 degrees F. Conversely, the western extent of the region, including much of Texas and Oklahoma, experienced temperatures ranging from 1 to 5 degrees F below normal. Texas reservoirs are reported to be 80% full, with many in the eastern part of the state in good condition (over 90% full), while numerous others in the western portion of the state continue to experience below-normal levels, according to Water Data for Texas (July 23). In terms of streamflow activity (July 23), the U.S. Geological Survey is reporting well above normal streamflows (>90th percentile) across areas of central and eastern Texas, eastern Oklahoma, and north-central Tennessee, while areas of the Texas Gulf Coast and South Texas Plains, northern Louisiana, and southern Mississippi are experiencing below normal levels (1st to 24th percentile range).
For the High Plains, on this week’s map, improvements were made in the region, namely in central northern Kansas, southeastern Nebraska, and South Dakota, where shorter-term precipitation (past 30-60 days) was normal to above normal. Additionally, these areas were showing improvements in other drought indicators including soil moisture, streamflow activity, and crop-related vegetation health indices. Conversely, conditions degraded on the map in areas of central South Dakota as well as in northern North Dakota, where dry conditions have prevailed during the past 30 to 60 days. For the week, light-to-heavy rainfall accumulations (ranging from 1 to 10 inches) were observed, with the heaviest amounts impacting northern Kansas and southeastern Nebraska. Below-normal average temperatures (ranging from 1 to 8 degrees F) were logged across most of the entire region.
In the West, Out West, generally dry conditions prevailed over much of the region with the exception of isolated areas of the Four Corners states, which observed monsoon-related thunderstorm activity with accumulations ranging from 1 to 4 inches. The storms led to targeted improvements on the map in Arizona. Likewise, isolated areas of the Pacific Northwest and eastern Plains of Montana and Wyoming observed isolated shower activity with accumulations generally of < 2 inches. On the map, persistent dry conditions led to expansion of areas of drought in southeastern Idaho, western Wyoming, and in eastern and southwestern Montana. For the week, average temperatures were mainly below normal with anomalies ranging from 2 to 10 degrees F and the greatest departures logged were observed in eastern Montana.
looking ahead Across the Midwest, Widespread improvements were made across the region in response to beneficial rainfall observed this week as well as during the past 30-day period. Storms during the past week delivered accumulations ranging from 1 to 6 inches, with the heaviest amounts observed in isolated areas of Missouri, Illinois, Indiana, and Kentucky. On the map, improvements were made in Minnesota, Iowa, Wisconsin, Illinois, Indiana, Michigan, and Ohio. For the week, average temperatures were below normal (2 to 12 degrees F) across the northern tier of the region, while the southern extent saw positive anomalies ranging from 1 to 6 degrees F above normal.
To view the 6-10 Day Precipitation Outlook Map, click here.
To view the 6-10 Day Temperature Outlook Map, click here.
To view the Monthly Drought Outlook Map, click here.