
To view the latest Oklahoma drought map, CLICK HERE.
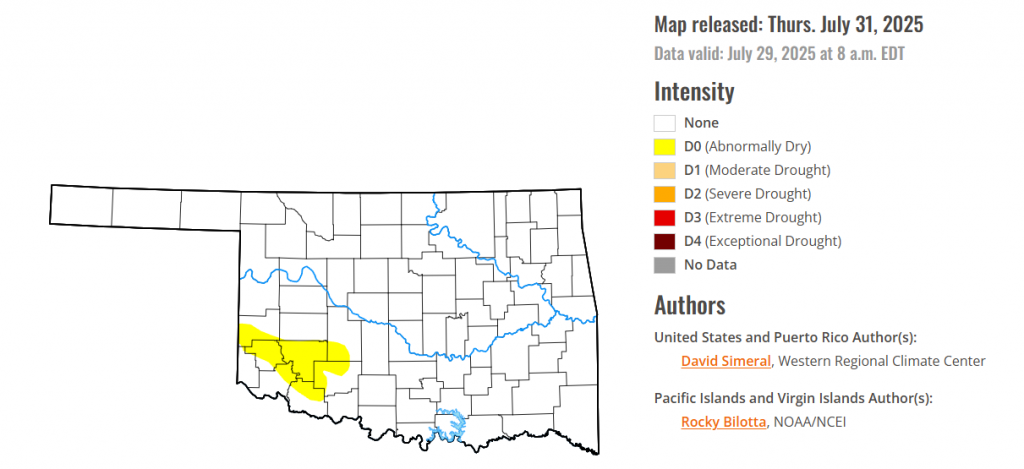
According to the latest Oklahoma drought monitor report, exceptional drought remains at zero percent, unchanged from the start of the calendar year.
Extreme drought or worse conditions remain at zero percent, unchanged since the week of October 29, 2024.
Severe drought or worse conditions remain at zero percent, unchanged since the week of May 29, 2025.
Moderate drought or worse conditions remain at zero percent, unchanged since last week.
Abnormally dry or worse conditions have persisted this week in parts of Greer county, Beckham county, and Kiowa county and have extended into Jackson county, Tillman county, Comanche county, and Caddo county.
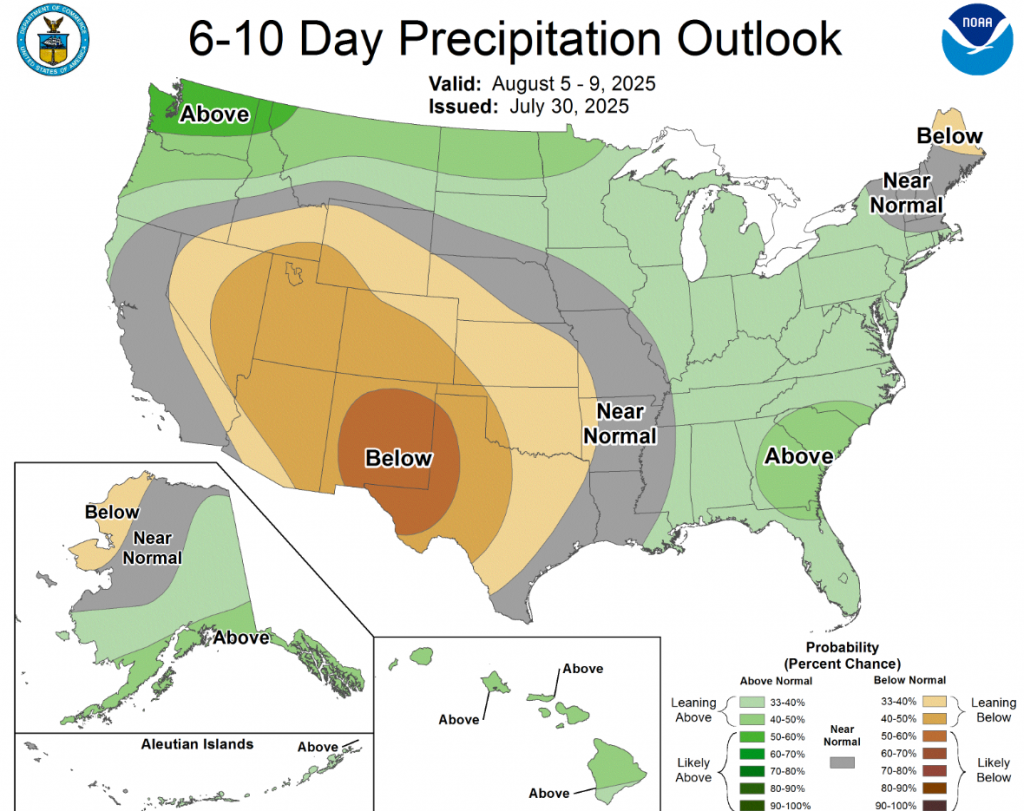
According to the 6-to-10-day precipitation outlook map, most of the state of Oklahoma is leaning below 33-40% chance of rain through August 9 with western oklahoma leaning below 40-50% chance through that same date.
To view the United States Drought Map, CLICK HERE.
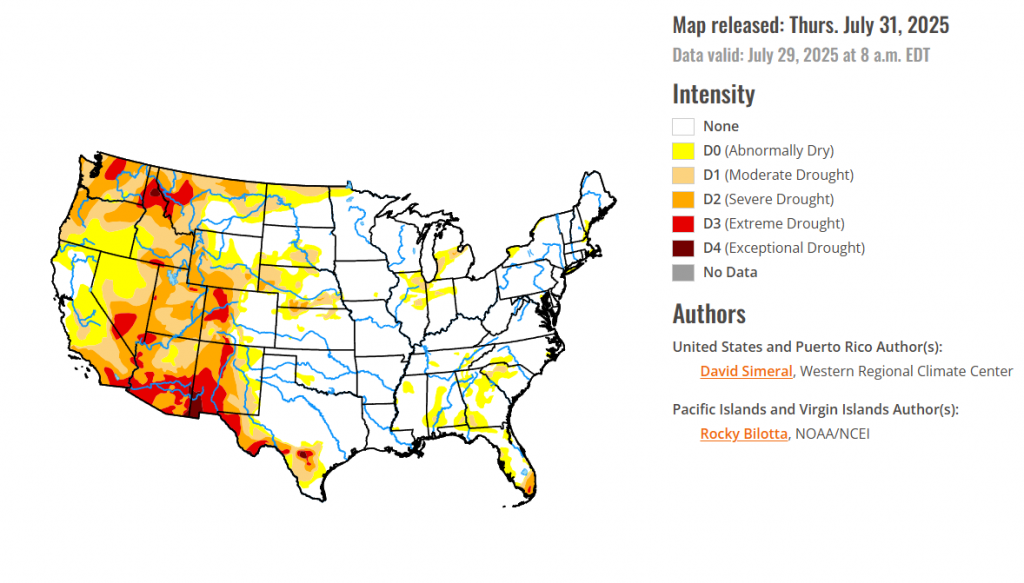
This U.S. Drought Monitor (USDM) week saw continued improvement in drought-related conditions across areas of the Midwest (Michigan, Ohio, Indiana, Illinois, Iowa, Minnesota), central and northern Plains (Kansas, Nebraska, Dakotas, eastern Montana), South (Texas), and in the Desert Southwest (New Mexico). During the past week, the most significant rainfall accumulations were observed across areas of Kansas, Missouri, Iowa, and Minnesota, where they ranged from 3 to 7+ inches. Elsewhere, short-term precipitation shortfalls (past 30 to 60 days) led to continued expansion of Abnormally Dry (D0) areas across the Southeast states including the Carolinas, Georgia, and Alabama as well as the introduction of isolated areas of Moderate Drought (D1) in Alabama, Georgia, and South Carolina where agriculture-related drought impacts are being reported. In the South, drought conditions continued to improve in western portions of Texas as well as in areas of eastern New Mexico where monsoonal storms have provided some minor relief to areas experiencing long-term drought. In the West, conditions continued to deteriorate across the Pacific Northwest (Oregon, Washington, Idaho) and areas of the Intermountain West (Wyoming, Utah, and Colorado), while areas of eastern Montana saw improvement in drought in response to precipitation events during the past few weeks. In terms of reservoir storage in the West, California’s major reservoirs continue to be at or above historical averages for the date (July 29), with the state’s two largest reservoirs, Lake Shasta and Lake Oroville, at 105% and 116% of average, respectively. In the Southwest, the U.S. Bureau of Reclamation is reporting (July 27) Lake Powell at 32% full (46% of average), Lake Mead at 31% full (51%), and the total Colorado system at 39% of capacity (compared to 44% of capacity the same time last year).
For the Hawaiian Islands, no changes were made on the map this week.
In Alaska, several areas of Abnormally Dry (D0) saw reductions on the map in response to rainfall during the past week.
In Puerto Rico, areas of Abnormally Dry (D0) were reduced in the north-central, northeastern, and southwestern portions of the island.
In the south,On this week’s map, improvements were made in areas of South Texas and the Trans Pecos region of Texas in response to above-normal precipitation during the past 30-120 days. In these regions, improvements were made in numerous drought categories (D1-D3). In other areas of the region, degradations occurred in southwestern Oklahoma, northern Mississippi, and central Tennessee, where rainfall has been below normal during the past 30 to 60 day period. For the week, average temperatures were above normal in the eastern and northern areas of the region, with anomalies ranging from 2 to 8 degrees F. Conversely, the western extent of the region, including areas in the southern half of Texas, experienced temperatures ranging from 1 to 4 degrees F below normal.
For the High Plains, On this week’s map, improvements continued from Kansas to North Dakota after another week of scattered shower activity with light-to-moderate accumulations. During the past 30 days, drought-related conditions have improved significantly in northern Kansas, eastern Nebraska, southeastern and southwestern South Dakota, and southwestern North Dakota as evidenced in a variety of drought monitoring products including streamflows, soil moisture, and vegetation health indicators. However, conditions have degraded in other parts of the region, including central South Dakota and northern North Dakota. For the week, average temperatures were generally above-normal average (1 to 6 degrees F) across the region, with eastern portions experiencing the largest departure, while far western portions of the Dakotas observed temperatures 1 to 4 degrees F below normal.
In the West, Out West, generally dry conditions prevailed over much of the region except for some isolated shower activity in northeastern California, northwestern Nevada, eastern New Mexico, eastern Colorado, and Montana. On the map, degradations were made across areas of the Pacific Northwest (Oregon, Washington, Idaho) and Intermountain West (Utah, Wyoming, Colorado). In the Pacific Northwest, streamflow activity continues to be well below normal levels across the Cascade Range of Oregon and Washington as well as in the mountain ranges of northern Idaho and western Montana. Similarly, poor surface water conditions were present in many streams and rivers of western Wyoming, Utah, western Colorado, central Arizona, and northern New Mexico. For the week, average temperatures were below normal across most of the region, with anomalies ranging from 2 to 10+ degrees F and the greatest departures observed across California and Nevada.
looking ahead Across the Midwest, Another week with scattered shower activity across drought-affected areas of the region led to continued improvements on the map from Minnesota to Ohio. For the week, rainfall accumulations ranged from 1 to 5 inches, with the heaviest amounts observed in isolated areas of northern Missouri, eastern Iowa, southern Minnesota, central Illinois, and northern Indiana. On the map, improvements were made in Minnesota, Iowa, Wisconsin, Illinois, Indiana, Michigan, and Ohio. Despite recent rainfall events and overall improving conditions across areas of the region, negative soil moisture anomalies are continuing to show up in northern Illinois, northeastern Indiana, and southern Michigan on several soil moisture monitoring data products. For the week, average temperatures were above normal (2 to 10 degrees F) across the region.
To view the 6-10 Day Precipitation Outlook Map, click here.
To view the 6-10 Day Temperature Outlook Map, click here.
To view the Monthly Drought Outlook Map, click here.