

To view the Oklahoma Drought Map, click here.
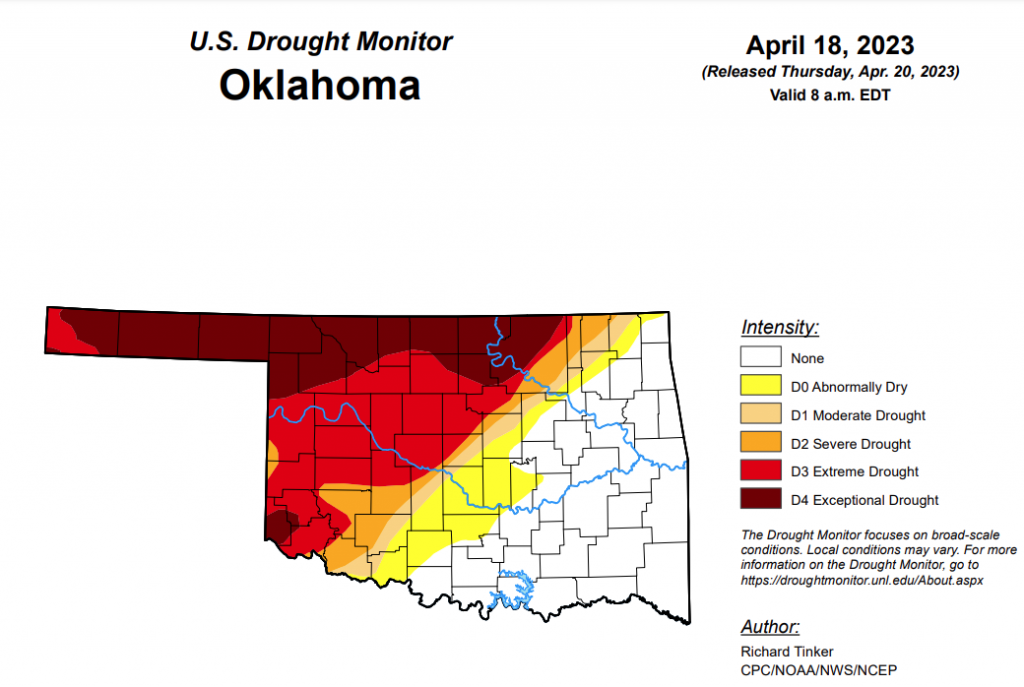
According to the latest Oklahoma Drought Map, Exceptional Drought has increased from last week’s 16.53 percent to 20.62 percent this week.
Extreme drought or worse has also increased from last week, now at 43.03 percent (last week’s percentage was at 39 percent.)
Severe drought or worse has increased slightly from last week’s 48.59 percent to this week’s 49.87 percent.
Moderate drought or worse has increased from 53.68 percent to 54.07 percent this week.
Abnormally dry or worse conditions have increased from last week’s 59.71 percent to this week’s 63.57 percent.
According to the 6-10-day precipitation outlook map, aside from the far west end of the panhandle, the entire state is leaning below a 40 to 50 percent chance of precipitation through April 29. The far west end of the panhandle is leaning below a 33 to 40 percent chance of precipitation through April 29.

To view the United States Drought Monitor Report, click here.
According to the lastest U.S. Drought Monitor, while most of the country received light precipitation at best last week, large totals fell on a few areas. Over 1.5 inches fell on the south half of Mississippi and the central Gulf Coast Region from Louisiana through the Florida Panhandle, with totals of 4 to 6 inches dousing parts of southeast Mississippi, southern Alabama, and coastal Louisiana. Totals also exceeded 1.5 inches in parts of the central and southern Florida Peninsula, with amounts reaching 6 inches in parts of the southern Peninsula and along the eastern coastline. A few swaths in the Upper Midwest recorded 1.5 to 3.0 inches, specifically from central to northeastern Minnesota, across much of Wisconsin and the western Upper Peninsula of Michigan, and from northeast Kansas and southeast Nebraska into southwest Iowa. Beneficial moderate to heavy precipitation also fell on parts of the Northern Rockies, northern Intermountain West, and Pacific Northwest. Most of the Nation west of the Appalachians, however, saw light precipitation at best. Precipitation was a little more widespread over the Appalachians and along the Eastern Seaboard, but most areas received subnormal amounts with only isolated patches reporting moderate to heavy precipitation.
On the whole, some areas of dryness and drought in the Southeast, the Upper Midwest, the northern Rockies, and the Pacific Northwest felt improvement over the course of the week. In addition, rapid snowmelt quickly recharged soil moisture and boosted streamflows from the Dakotas to the western Great Lakes Region, prompting improvement in some areas. But most locations experiencing abnormal dryness or drought saw conditions persist or intensify, with deterioration to D3 or D4 (Extreme to Exceptional Drought) noted in some areas across the western Florida Peninsula and the southern half of the Great Plains.
In the Southern Plains, heavy rainfall also eased dryness and drought from southern Louisiana eastward into the Florida Panhandle. Moderate drought there is now restricted to southeastern Louisiana, where substantial multi-month precipitation shortfalls remained despite a wet week. Elsewhere, Tennessee and the Lower Mississippi Valley remained free of dryness and drought, as did eastern Texas and southeastern Oklahoma.
A tight gradient exists from near normal conditions in the aforementioned areas to extreme or exceptional drought (D3-D4) over portions of central and western Texas and Oklahoma. Beneficial rains fell on Deep South Texas and southeastern Texas, bringing limited improvement, but a dry week for most of the central and western sections of Texas and Oklahoma meant conditions persisted or deteriorated there. Most locations across central and northern Oklahoma have 3-month SPEI below the 5 percentile threshold, with 90-day precipitation 3 to 5 inches below normal.
As of April 16, the Weekly Weather and Crop Bulletin reports 53 percent of Oklahoma winter wheat and 52 percent of Texas winter wheat crops in poor or very poor condition.
In the High Plains, the majority of Kansas and portions of Nebraska remained entrenched in D3 to D4 (extreme to exceptional drought). Some D3 and D4 expansion took place there, but a few small areas saw limited improvement from localized rainfall. Some areas of deterioration were also noted across D0 to D2 areas in central and eastern Colorado, but most of the state was unchanged from last week, as was Wyoming.
Farther north, precipitation was unremarkable and generally below normal in the Dakotas, but rapid melting of the unusually deep snowpack has been recharging soil moisture and boosting streamflows, with river flooding reported in some areas. As a result, dryness and drought generally eased this past week, reducing D0 and D1 coverage, and removing last week’s D2 from southeastern South Dakota.
The Weekly Weather and Crop Bulletin reported poor or very poor conditions for 60 percent of Kansas winter wheat, 40 percent of Nebraska winter wheat, and 38 percent of Colorado winter wheat.
In the West, areas of moderate to heavy precipitation brought continued improvement to many of the dryness and drought areas in Washington, Oregon, and Montana. Improvement was also noted across parts of Utah as the unusually deep snowpack continued to slowly melt, recharging soil moisture and boosting streamflows.
From May 5 to August 9, 2022, anywhere from 25 to 39 percent of the West Climate Region was entrenched in D3 or D4 drought. As of April 18, only about 1.5 percent of the region was in D3, restricted to interior northeastern Oregon.
According to the California Department of Water Resources, mid-April statewide reservoir contents were about 19.5 million acre-feet in 2021, and less than 18 million acre-feet in 2022. But after abundant December-March precipitation in most of the state, mid-April reservoir storage has rebounded to around 27.5 million acre-feet this year, slightly above the long-term average of around 26 million acre-feet at this time of year.
Looking ahead, during the next five days (April 19-24, 2023) moderate to heavy precipitation (over an inch) is expected in the Pacific Northwest, higher elevations in the central and northern Rockies, much of the eastern Great Plains, most of the Mississippi Valley and Great Lakes Region, the Appalachians, the Carolinas, the Middle Atlantic Region, and the Northeast. Totals of 1.5 to 3.0 inches is forecast for a broad area from the Mississippi/Ohio Rivers’ Confluence Region southward across the west side of the lower Mississippi Valley and the eastern half of Texas. In contrast, most areas from the west side of the Great Plains to the Pacific Coast (outside the higher elevations and areas west of the Cascades) are expecting light precipitation at best. Light amounts of precipitation (less than one-quarter inch) are also expected in Florida, Georgia, and some adjacent locales.
The Climate Prediction Center’s 6-10 day outlook (valid April 25-29) shows above-normal precipitation favored over the vast majority of the central and eastern contiguous states and Alaska. Odds are only marginally enhanced in most areas, but odds exceed 50 percent that amounts will be in the wettest one-third of the historical distribution in part of the South Atlantic States and in southeastern Alaska. Subnormal precipitation is more favored in most areas from the Rockies to the Pacific Ocean, with much of the northern Great Basin having at least a 50 percent chance for precipitation totals in the lowest one-third of the historical distribution. Enhanced chances for subnormal temperatures cover a large area from the Plains to the Middle Atlantic Region, especially across the northern Plains, upper Midwest, and upper Mississippi Valley. Colder than normal temperatures are also expected across most of Alaska outside southeastern areas. Warmer than normal weather is forecast for the southern Rockies, the Intermountain West, and West Coast, as well as across northern New England and locations across and near the Florida Peninsula.
To view the 6-10 Day Precipitation Outlook Map, click here.
To view the 6-10 Day Temperature Outlook Map, click here.
To view the Monthly Drought Outlook Map, click here.


