

To view the Oklahoma Drought Map, click here.
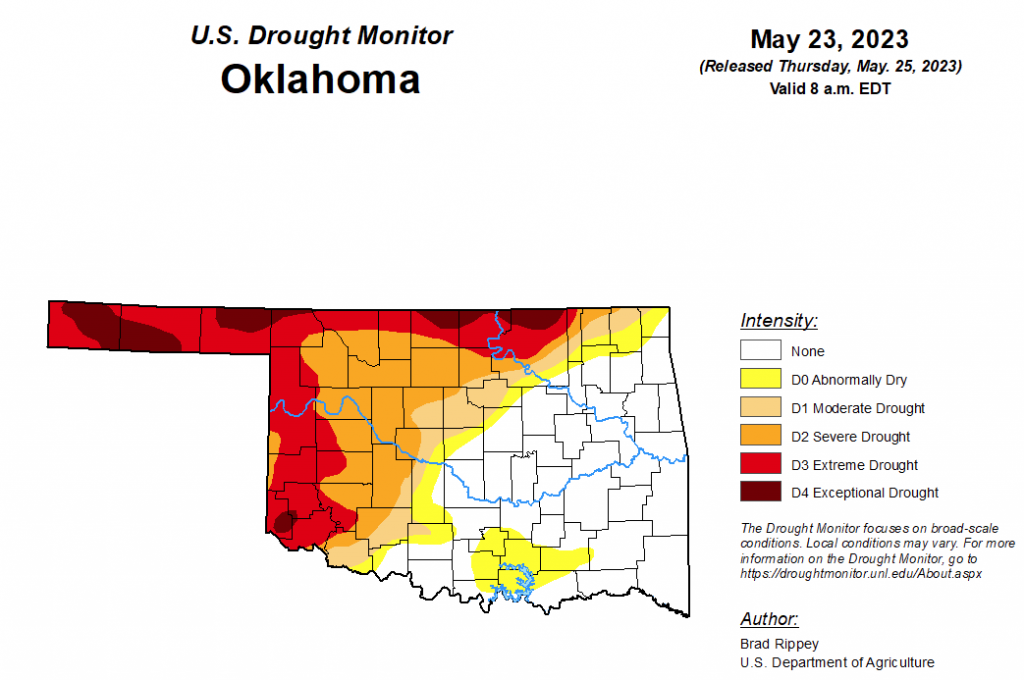
According to the latest Oklahoma Drought Map, Exceptional drought has improved from last week, decreasing from last week’s 8.88 percent to this week’s 5.68 percent.
Extreme drought or worse has improved significantly, decreasing from last week’s 30.67 percent to this week’s 25.09 percent.
Severe drought or worse has decreased slightly from last week’s 43.81 percent to this week’s 43.18 percent.
Moderate drought or worse conditions have worsened slightly, moving from last week’s 50.19 percent to this week’s 50.44 percent.
Abnormally dry or worse conditions have also worsened, moving from last week’s 55.79 percent to this week’s 60.14 percent.
According to the 6-to-10-day precipitation outlook map, the majority of the state, aside from the northeast corner, down into the southeast corner, is leaning above a 40 to 50 percent chance of precipitation through June 3. The remaining part of the state is leaning above a 33 to 40 percent chance of precipitation through that date.
To view the United States Drought Map, click here.
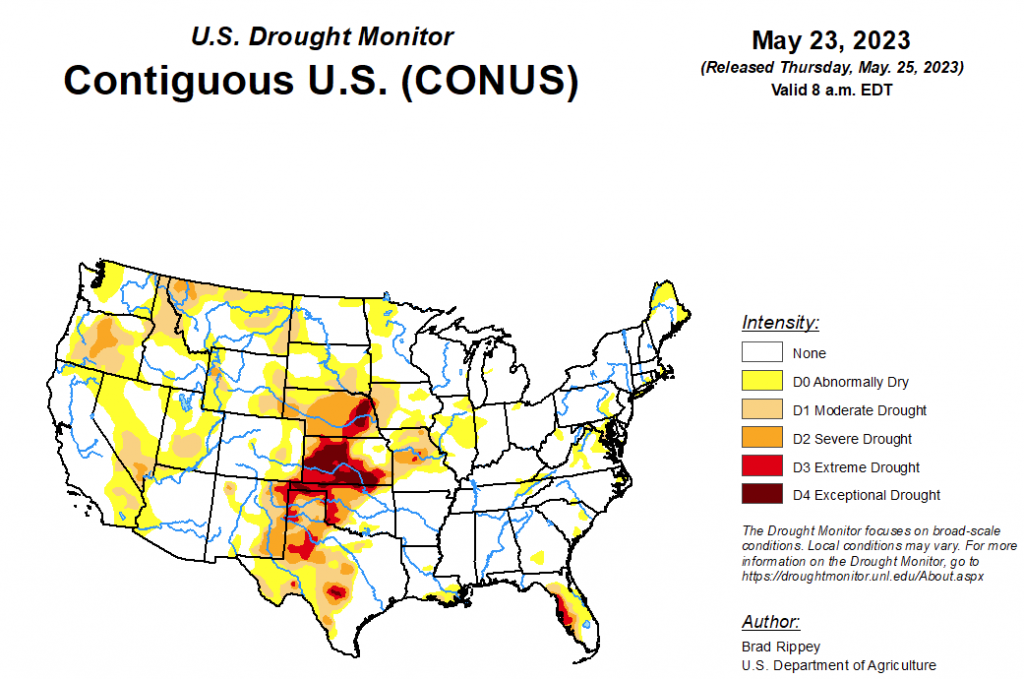
According to the latest U.S. Drought Monitor, showery weather across the southern half of the Plains provided additional drought relief, following the previous week’s major storm. Still, much of the rain arrived too late to rescue winter wheat, although rangeland, pastures, and summer crops greatly benefited from the soil moisture improvements. Variable rainfall extended westward into the central and southern Rockies and eastward to the southern Atlantic Coast, maintaining generally favorable growing conditions for pastures and summer crops. Eventually, rain shifted northward along the northern Atlantic Coast, easing dry conditions. Meanwhile, light showers dotted the Northwest, while little or no rain fell across the remainder of the country, including the north-central U.S. and the Far West. A week-long hot spell elevated temperatures in the Pacific Northwest, although temperatures began to fall late in the drought-monitoring period. A separate area of heat, accompanied by high humidity, affected much of the Deep South. Elsewhere, near- or slightly below-normal temperatures prevailed across the central and southern Plains, while cooler-than-normal weather covered much of the Northeast and environs.
In the Southern Plains, significant drought improvement occurred in some of the hardest-hit areas of Oklahoma and Texas, as rain benefited rangeland, pastures, and summer crops. In Texas, rangeland and pastures rated in very poor to poor condition by the U.S. Department of Agriculture improved from 51 to 36% during the week ending May 21. On the same date, topsoil moisture was rated less than one-third very short to short in Texas (29%) and Oklahoma (28%). Still, even with abundant showers and thunderstorms, pockets of extreme to exceptional drought (D3 to D4) persisted in western and central Texas and across the northwestern half of Oklahoma. Farther east, most areas remained free of dryness and drought, aside from a few areas in the central Gulf Coast region.
In the High Plains, following the previous week’s substantial drought relief, mostly dry weather returned across the High Plains. However, locally heavy showers continued in parts of eastern Colorado and southern and western Kansas, leading to some additional reductions in the coverage of moderate to exceptional drought (D1 to D4). By May 21, Nebraska led the U.S. with rangeland and pastures rated 55% very poor to poor, according to the U.S. Department of Agriculture. On the same date, Nebraska led the High Plains with topsoil moisture rated 58% very short to short, followed by Kansas at 52% and South Dakota at 36%. Much of the recent rainfall has bypassed eastern sections of South Dakota and Nebraska, with some increase in drought coverage noted in the latter state.
In the West, some further improvements were introduced across roughly the southern two-thirds of the West, a combination of precipitation—especially in the central and southern Rockies—and further analysis and assessment of snow that fell during the impressively wet winter of 2022-23. In fact, recent warmth has caused some rapid melting of high-elevation snowpack, leading to some flooding. In south-central Idaho, for example, the Big Wood River at Hailey recently rose more than 2 feet above flood stage to reach its highest level since May 2017. The northern tier of the western U.S. received less winter precipitation, and in combination with the recent early-season heat wave, has experienced the return of patchy dryness (D0). During the week ending May 21, topsoil moisture rated very short to short by the U.S. Department of Agriculture increased from 32 to 47% in Oregon and 23 to 40% in Washington.
Looking ahead, a slow-moving Southeastern disturbance interacting with a plume of Atlantic tropical moisture could lead to heavy rain in the southern and middle Atlantic States, especially in coastal areas, through the Memorial Day weekend. Five-day rainfall totals could reach 2 to 4 inches or more from Florida to the Carolinas. Meanwhile, a cold front draped across the northern High Plains and the northern Intermountain West will remain the focus for widespread rain, which could total at least 1 to 2 inches in Montana and portions of neighboring states. A separate area of rain—in the form of daily thunderstorms—will affect the central and southern High Plains, resulting in additional drought relief. In contrast, dry weather will prevail during the next 5 days in much of the Southwest, Midwest, and Mississippi Valley. The NWS 6- to 10-day outlook for May 30 – June 3 calls for the likelihood of near- or above-normal temperatures and precipitation across most of the country. Cooler-than-normal conditions should be confined to an area stretching from southern California to the southern High Plains, while drier-than-normal weather should be limited to western Washington and an area stretching from the Great Lakes region to New England.
To view the 6-10 Day Precipitation Outlook Map, click here.
To view the 6-10 Day Temperature Outlook Map, click here.
To view the Monthly Drought Outlook Map, click here.


