The June USDA reports on Acreage and Stocks, released on June 30, 2023, made a significant splash on grain markets after an already volatile week. With no new fundamentals to trade, wheat prices found little insulation from movements in corn and soybean markets. From June 21 to June 30, Chicago Board of Trade corn futures were down $1.14 on the week and CBOT Soft Red Winter wheat (SRW) futures were down $1.06. Minneapolis Grain Exchange (MGEX) Hard Red Spring (HRS) and Kansas City Board of Trade (KBOT) Hard Red Winter (HRW) futures dropped 63 cents and 75 cents, respectively.
Before Friday’s USDA reports, dryness in the U.S. Midwest, particularly in the Corn Belt, wreaked havoc on wheat and corn markets as corn conditions hovered at their lowest rating since 1988. Meanwhile, instability in wheat markets persists with on-going news from the conflict in the Black Sea.
June Acreage Report
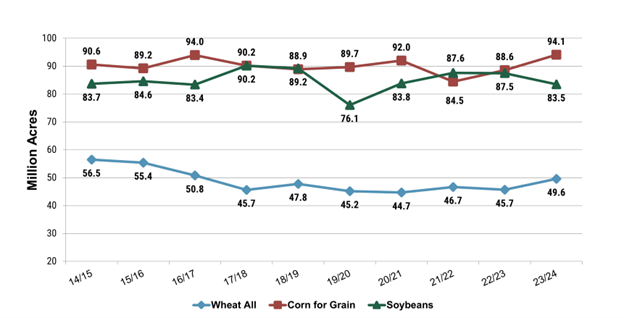
The Acreage Report estimated the total U.S. wheat planted area at 49.6 million acres (ma) or 20.1 million hectares (mh), up 9% from 2022 but 300,000 acres less than the March estimates. The 2023/24 planted area still represents the largest planted area since 2016/17. Little changed from the March estimates with the winter wheat area projected at 37.0 ma (14.9 mh), up 11% from last year. The most significant increase occurred in the SRW wheat area as it registered a 17% increase from the year prior.
As discussed in previous articles, high prices in the fall of 2022 incentivized farmers to plant additional acres, and the USDA reports confirms that shift. New to the June report, the HRS area was forecast at 10.5 ma (4.2 mh), which is up 5% from the March estimates and 5% from 2022. Meanwhile, durum is predicted at 1.48 ma (0.6 mh), down 200,000 acres from the March estimates and 9% below 2022/23.
More Corn Than Expected
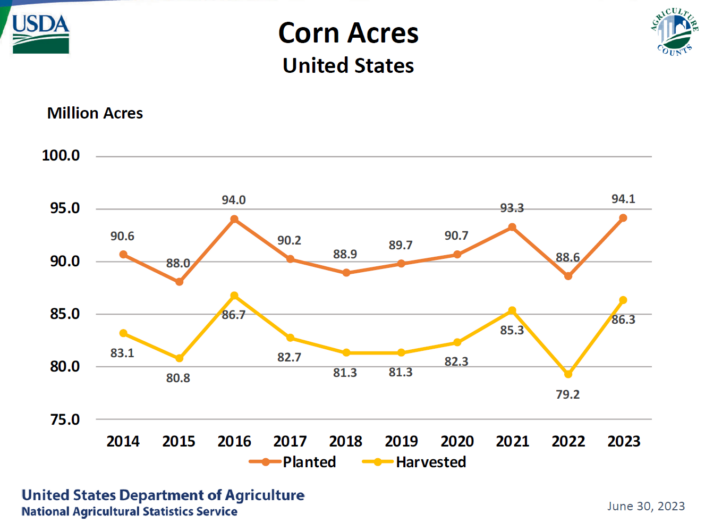
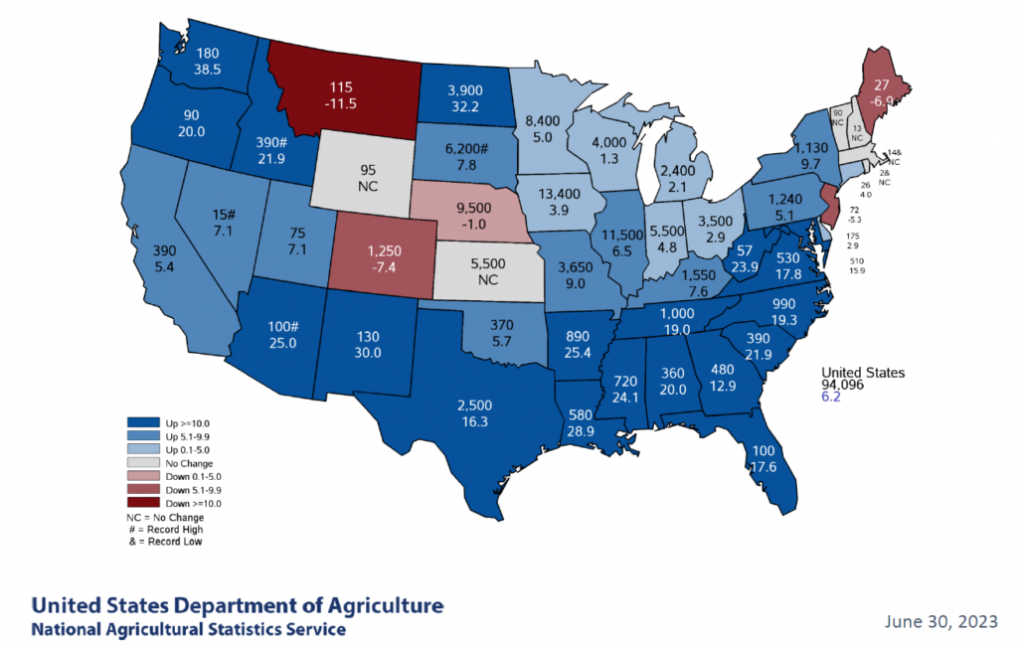
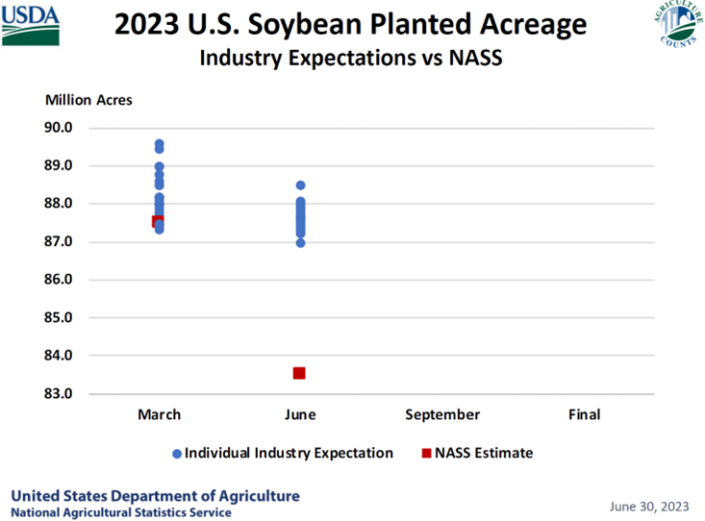
Corn and soybeans were arguably the largest surprise and the most significant contributor to Friday’s volatility. USDA forecast corn area at 94.1 ma (38.1 mh), which would be the third highest area on record, and is up from 88.6 ma (35.9 mh). The USDA NASS map at the top of this page shows an estimate of how many acres of corn are planted in each state and the percentage change from 2022. Soybean area was down 5% on the year and below trade estimates, coming in at 83.5 ma (33.8 mh).
The impact of the USDA Acreage report released June 30 was bullish for soybeans, bearish for corn, and varied for wheat. That day, July 2023 CBOT SRW futures closed down 97 cents on the week at $6.36/bu. KCBT HRW futures were down 58 cents, at $8.01/bu. MGEX HRS futures were down 63 cents at $8.02/bu. CBOT corn futures were down 76 cents at $5.55/bu. CBOT soybean futures were up 63 cents, at $15.57/bu.
Quarterly Grains Stocks Report
The June Grain Stocks Report, published on June 30, USDA estimates that old crop wheat stocks are down 17% from 2022 at 15.8 MMT. On-farm stocks are 3.4 MMT, up 34% from 2022 but 22% below the five-year average. The larger on-farm stocks indicate that farmers hold a larger share of the wheat crop than years prior. Meanwhile, off-farm wheat stocks are down 25% at 12.4 MMT.
Key Takeaways
The week’s volatility and the impact of the reports demonstrate persistent risks in the current wheat market and the ever-present influence of the weather. As the crop year progresses, it is crucial to keep a watchful eye on corn and soybean markets, as fundamentals in these markets can have consequences on the wheat market. Likewise, as the harvest pace ramps up and more information about the new crop becomes available, markets will begin to price in the availability of the supply, anticipated demand, and quality of the year’s crop.
Stay current on the 2023 wheat harvest via the U.S. Wheat Associates Harvest Reports and market moving factors in the weekly Price Report.