

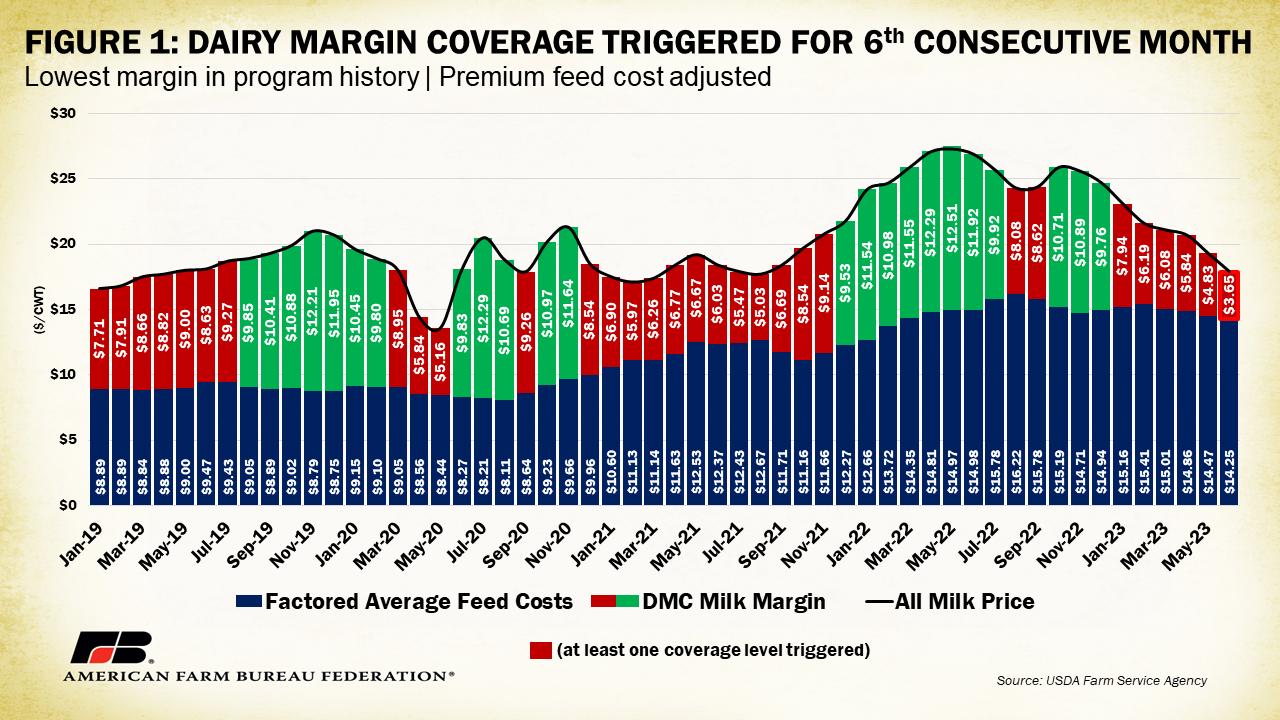
For the month of June, the Farm Service Agency reported a $3.65 per hundredweight milk margin above feed costs, the smallest margin since the Dairy Margin Coverage program was authorized in the 2018 farm bill. High 2022 milk prices dropped precipitously through much of 2023, shrinking thousands of dairy farm families’ milk checks. A combination of increased production in the first half of the year, depressing export demand and persistently high operating expenses have contributed to the fall in prices. With an impending national Federal Milk Marketing Order hearing scheduled to begin in late August and ongoing farm bill discussions, much focus will be on the dairy industry in the coming weeks and months.
The Dairy Margin Coverage (DMC) program provides a level of risk protection to dairy producers under low margin conditions, which is when milk prices are low and/or feed costs, on average, are high. This voluntary program provides payments when the calculated national margin falls below a producer’s selected coverage trigger. The margin is the difference between the average price of feedstuffs (the price of hay, corn, and soybean meal) and the national all-milk price.
June was the sixth consecutive month with calculated margins below the upper $9.50 per hundredweight trigger cutoff, at just $3.65 per hundredweight. This marks the 31st month of margins below the $9.50 per hundredweight top trigger level out of the 54 total active months of DMC, meaning at least some payments have been triggered for 57% of the program’s duration. It also marks the first time the program’s “catastrophic” $4.00 margin level has been breached, a premium-free level of protection. Prior to May ($4.83/cwt) and June ($3.65/cwt) of this year, DMC milk margins were lowest in August 2021 ($5.03/cwt). In the analyzed period, DMC milk margins were at their highest in May 2022 at $12.51 per hundredweight.
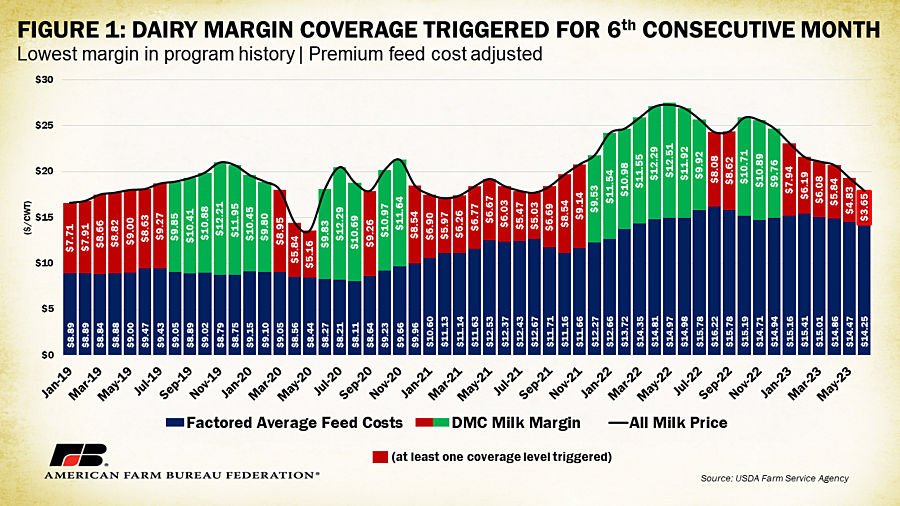
You may notice the all milk price, which represents the average gross price farmers received in the given month per hundredweight of milk sold at an average fat test, was not at its lowest in June ($17.90/cwt). In May 2020, during the peak of COVID-19 lockdowns, all milk prices hit $13.60/cwt, their lowest level since DMC became active. Even at that much lower all milk price level, margins were $5.16/cwt or $1.51/cwt higher than they were in June 2023; unworkable but still higher.
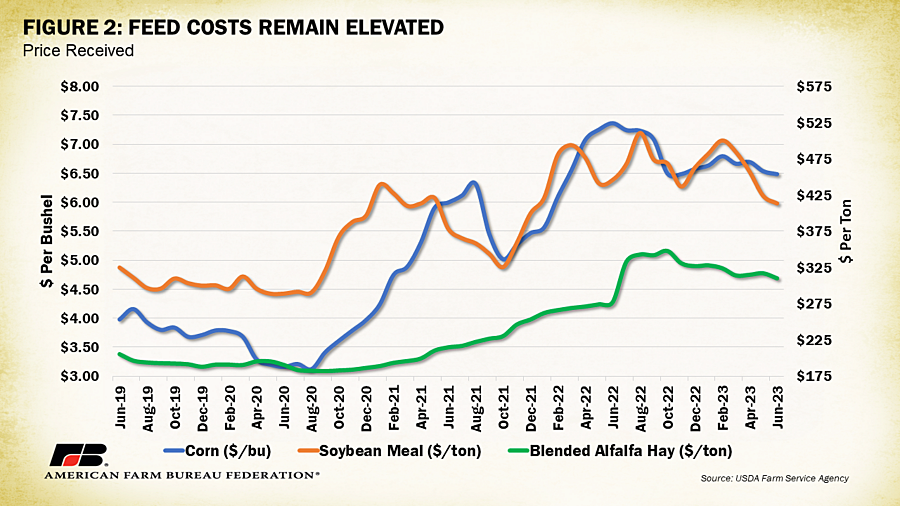
Several factors are at play in the outcome of the June DMC margin. A significant one being feed costs, the basis of the DMC margin calculation, which have remained elevated. The June corn price of $6.49/bu, although down from spring 2022 highs, remains 29% above the 2019-2023 average. Similarly, June blended premium alfalfa costs remain 28% above the 2019-2023 average at $310/ton. Alfalfa values represent the 2021 retroactive adjustment within the feed cost calculation using 100% premium alfalfa hay rather than 50%. Soybean meal costs are a more modest 9% above the 2019-2023 average at $413/ton. Combined and adjusted per hundredweight of milk produced, the Farm Service Agency calculated the June factored average feed cost at $14.25, 24% higher than the 2019-2023 average. These elevated feed costs bite into any price farmers receive, diminishing profit margins. Atop continued uncertainty between Russia and Ukraine, high crop input expenses and unclear harvest expectations, feedstuff prices are expected to remain above average.
Even with high feed costs, total U.S. milk production in the first half of 2023 surpassed 2022 production by 747 million pounds (0.7%). Milk production per cow was up 0.4%, or about 47 pounds during the same timeframe, a testament to the continued improvement of nutrition, genetics and other animal care and production practices farmers have invested in and implemented. Importantly, dairy production includes numerous other inputs and operating expenses not included in the DMC calculation, reducing take home margins further.
In order to buffer against possible price declines, any increase in production must be offset with demand through dairy product sales and consumption. Many U.S. dairy product manufacturers had bet on the American consumer’s growing appetite for cheese, investing in capacity expansions and new plant construction across the nation and particularly the Midwest. Indeed, domestic consumption of cheese since January 2019 has increased 32 million pounds at an increase of about 0.33% each month.
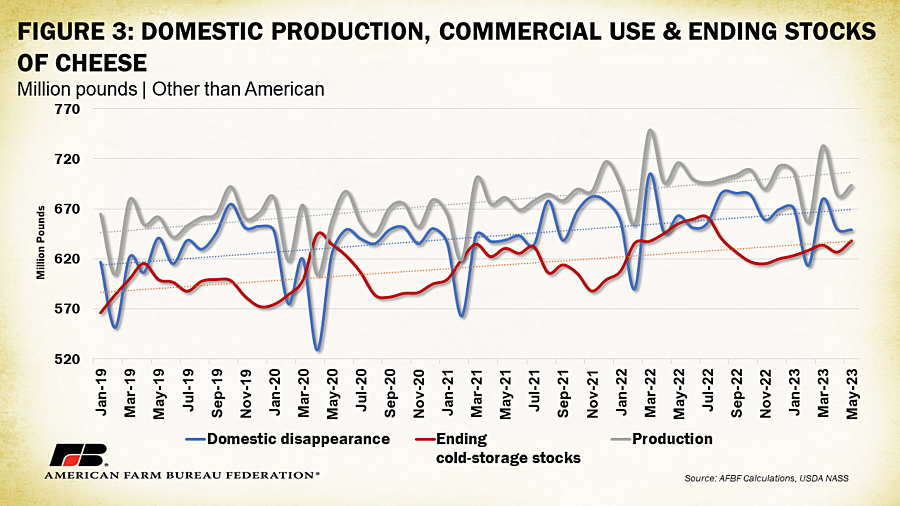
Unfortunately, production from the myriad of new cheese plants across the nation combined with existing stocks and cheese imports are outpacing domestic consumption. Between January and May of 2019, monthly domestic cheese production averaged 653 million pounds. Between January and May of this year, monthly domestic cheese production averaged 694 million pounds, a 6% (42 million pound) increase over the same period in 2019. Average monthly ending cold storage stocks between January and May of this year averaged 629 million pounds, 37 million pounds higher (6%) than the same period in 2019. Cold storage metrics show the end-of-month volume in longer-term (30+ days) cooled storage throughout the U.S. This excess supply depresses the cheese market, contributing to declines in milk prices received by farmers. January to May monthly cheese imports, which make up a much smaller portion of total supply, are up 5% over January-May of 2019 levels, shifting from about 20 million pounds a month to over 21 million pounds a month. Domestic purchases of foreign dairy products further burden the U.S. cheese market.
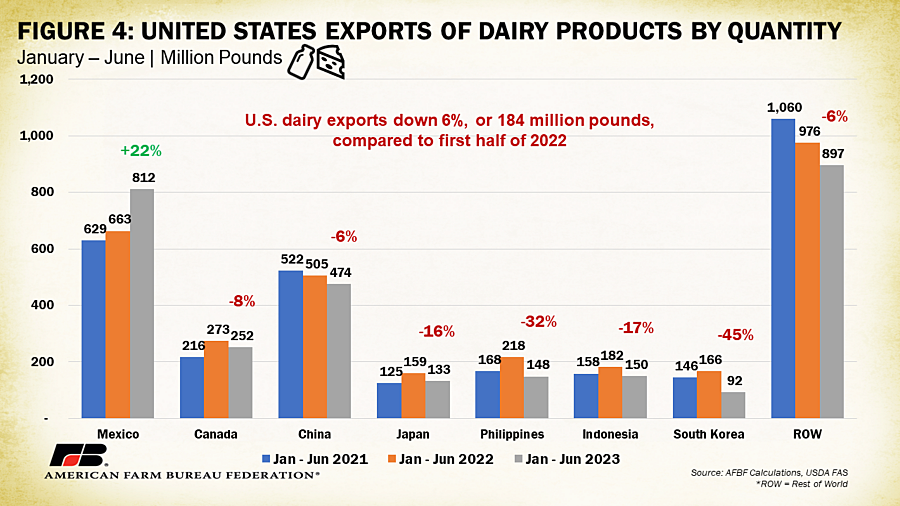
In periods of excess supply, the hope is that export markets can soak up the difference. This was the case in 2021 when exports of dairy products in the first half of the year exceeded the prior three-year average by 14% or 365 million pounds of dairy products. It was also the case in the first half of 2022, when dairy product exports surpassed 2021 levels by 119 million pounds (4%). The first half of 2023 has been a different story. Exports have dropped 184 million pounds (6%) in terms of quantity and $482 million (10%) in terms of value. Improved production in the European Union and countries like New Zealand has made foreign products more competitively priced, sending buyers to competitor nations. Demand in places like Southeast Asia has been more depressed than expected. U.S. exports in terms of volume for the first half of 2023 have been down 6% in China, 16% in Japan, 32% in the Philippines, 17% in Indonesia and 45% in South Korea. These countries makeup the third, fourth, fifth, sixth and seventh top dairy product export markets for the United States, respectively. In addition, exports to our northern neighbor and second-largest market, Canada, have slumped 8% in terms of volume, though they are up 7% in terms of value. Mexico, our leading dairy export market, has been a silver lining in the cloud of declining exports, with the first half of 2023 up 22% (149 million pounds) in terms of volume and up 7% ($75 million) in terms of value. Without foreign consumption of excess U.S. dairy supply the resulting price received by farmers has faced strong downward pressures, yet another factor contributing to the lowest DMC margin yet.
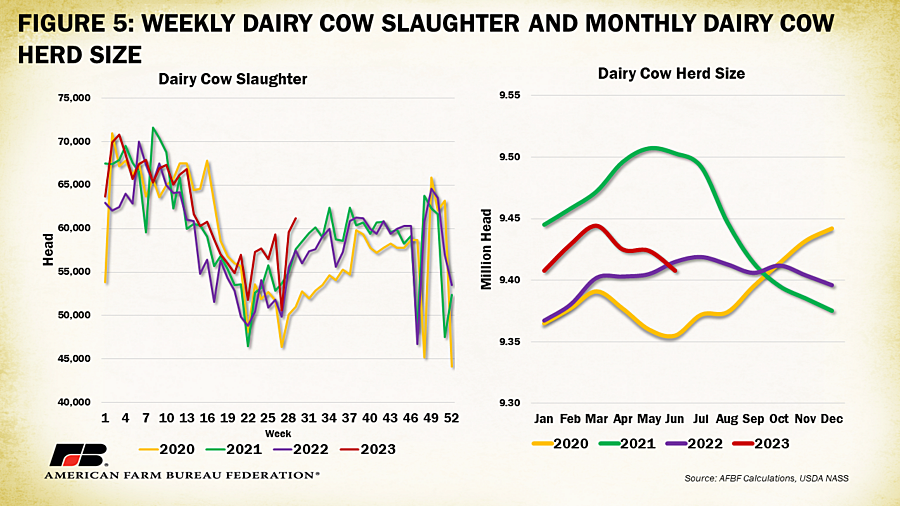
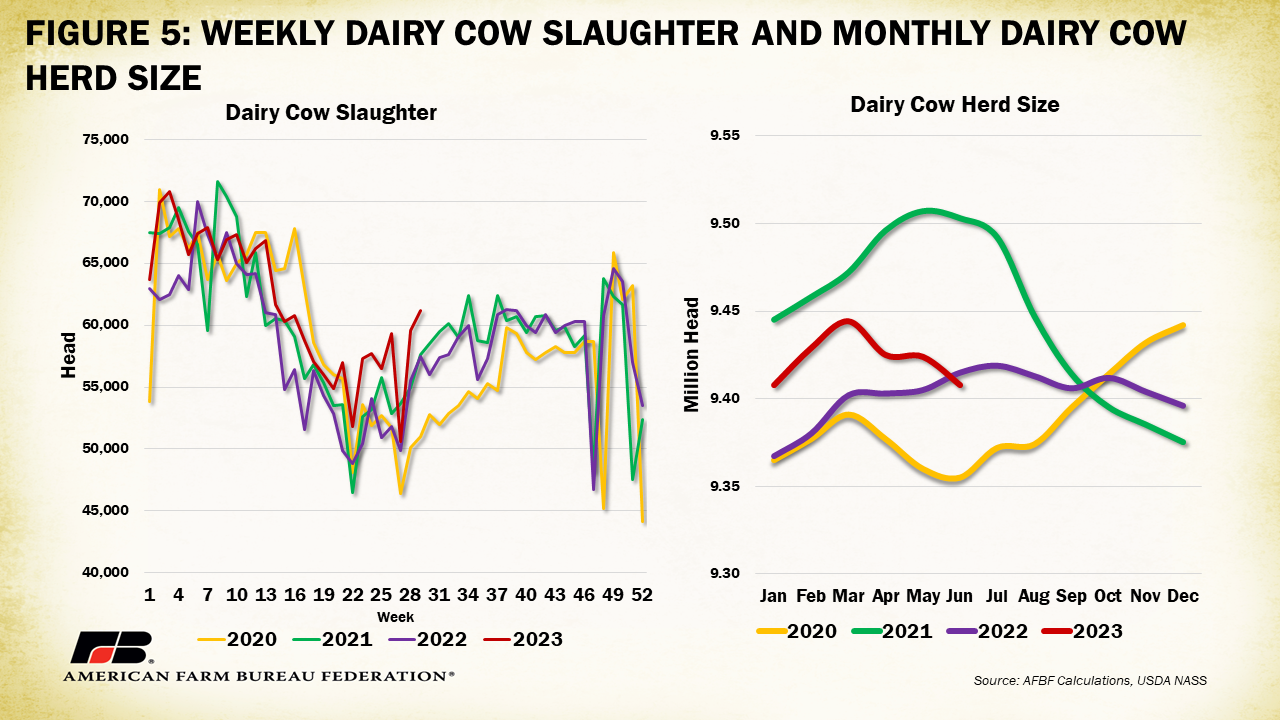
So, what comes next? Will margins drop even lower? Signs do show a likely bottom in the recent price declines for dairy products. One of the best measures for future declines in production is the weekly dairy cow slaughter rate: The more milking cows going to slaughter, the lower the resulting milk production, all else held equal. Average weekly dairy cow slaughter is up 4% in the first half of 2023 over the prior three-year average. Isolating the past seven weeks, this metric jumps to a slaughter rate 9% higher than the prior three-year average. Correspondingly, the dairy herd has contracted from its 2023 March peak of 9.44 million head to a bit over 9.4 million head in June – a drop of 36,000 cows. This is below the levels during the same month in both 2022 and 2021 and signals a drop in future milk production. August and September often yield the lowest milk production numbers due to seasonal production characteristics.
Domestic demand dynamics will also play a role in improving milk margins. Schools, a large market for fluid milk and dairy products, begin reopening to students in August. Fall also marks the start of the holiday season, which is also associated with increased dairy product purchases. We will see how this seasonal boost interacts with broader market trends in the coming months.
Conclusion
Risk management programs like DMC provide a revenue buffer for producers feeling the tight squeeze of shrunken operational margins. Persistently high feed prices, strong domestic supply and large product stocks will continue to pressure these farmer margins from both the cost of production and market price angle. Weakening export markets further depress the outlook for market improvements. The June $3.65/cwt above feed cost milk margin erases much of the prior year gains that, at the time, brought needed optimism to the industry. With a long way to go to a margin higher than $9.50, at least some producers will continue to receive DMC program payouts, though even those who do receive payments are restricted by a tier one 5-million-pound limit – about 3 million pounds below average U.S. dairy farm production of 8 million pounds (compare to 6 million pound per farm average in 2018). Farm bill programs like DMC are vital to ensuring a stable farm economy that provides food security to millions of consumers domestically and abroad.
Story Credit:


