

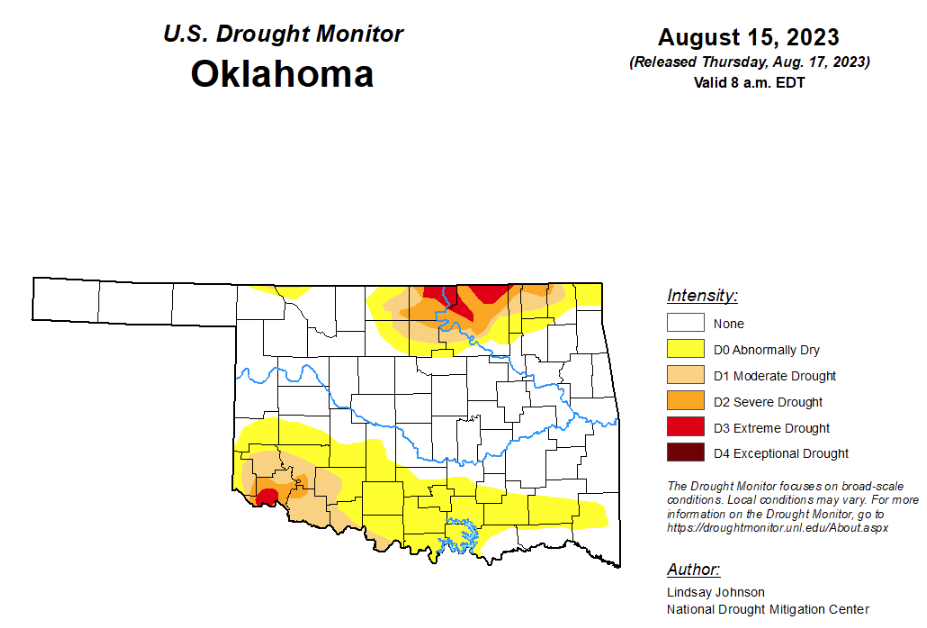
To view the Oklahoma Drought Map, click here.
According to the latest Oklahoma Drought Monitor, exceptional drought remains at zero percent, unchanged from the past few weeks.
Extreme drought or worse is unchanged from last week’s 1.60 percent.
Severe drought or worse has improved slightly from last week’s 5.84 percent and is now sitting at 5.35 percent.
Moderate drought or worse has improved slightly from last week’s 12.81 percent and is now at 12.75 percent.
Abnormally dry or worse conditions have improved from last week’s 37.75 percent and are now at 35.99 percent this week.
According to the 6-10-day precipitation outlook map, the panhandle of Oklahoma is leaning below a 33 to 40 percent chance of precipitation through August 26. The rest of the state is leaning below a 40 to 50 percent chance of precipitation through that date.
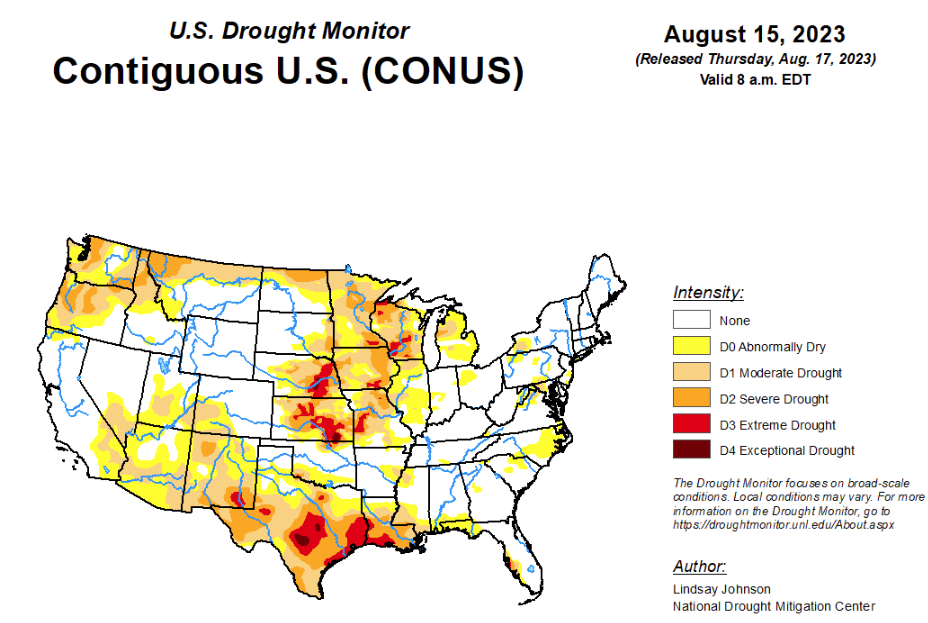
To view the United States Drought Map, click here.
According to the latest U.S. drought monitor, conditions continued from last week with the southern part of the country, where above-normal temperatures and mostly dry weather across the Rio Grande Valley, Texas, and the lower Mississippi Valley saw drought conditions continue to deteriorate. Drought intensified across Texas and the lower Mississippi Valley, particularly in eastern Texas, Louisiana and south-central Mississippi. The Monsoon remains suppressed with increasing short-term drought across Arizona, New Mexico and southwest Colorado. Frequent rounds of heavy rainfall occurred from the Northeast into the central Mississippi valley, into southern Missouri and the upper Midwest. The continuing west conditions are improving drought across parts of the Corn Belt and much of the southern and central Midwest. Farther to the north, drought continues to intensify across northern Wisconsin, North Dakota, Montana and Washington. Hawai’i continued to experience dry conditions, particularly on the leeward side of the islands. Conditions that came to a peak on August 8th with deadly Lahaina Fire on Maui.
In the Southern Plains, much of the South, from Texas to Mississippi, saw temperatures of 4 to 6 degrees above normal for the past two weeks. While northeastern Mississippi, Tennessee, northern Arkansas, and northeast Oklahoma, much of the rest of the south missed out. Northern Oklahoma and Arkansas benefited from this above-normal precipitation, allowing for the removal of D0 conditions. Meanwhile, D0 expanded in eastern Arkansas into northwest Mississippi due to continued dryness over the last 30 days, combined with extreme temperatures. A widespread expansion of dry conditions occurred from southern Mississippi into east-central Texas due to a continued lack of rainfall (about 8 – 14 inches over the last 90 days) combined with above normal temperatures. For example, rainfall in Southern Mississippi is well below normal for the year, with Crystal Springs only seeing 2.99 inches of rain for July and August. At the same time high temperatures of over 95 degrees have been recorded over 26 days — with 14 of those days over 100 degrees. Nearly all counties in southeastern and south-central Mississippi are in a burn ban, a commonality seen across the rest of the South. Many livestock producers are having to feed hay and have begun selling their livestock, leading to record cattle sales in various communities. Conditions from western Louisiana into eastern Texas continued to deteriorate, with D3 (extreme drought) expanding from the Louisiana boot heel into Houston, down to Corpus Christi. In Shelby County, Texas, little to no rain has fallen in the last 30 days, which has been accompanied by weeks of triple-digit heat. Agriculture across the southern Gulf Coast has seen enormous impacts due to this lack of precipitation and extreme heat. Eastern and central Texas also had extensive degradations with expansions of D2 (severe drought) through D4 (exceptional drought). Presently, Austin’s precipitation from June 1 to August 15 ranks as the fourth driest on record. Belton and Stillhouse Hollow reservoirs are also the driest on record for this time of year. Near Midland, Texas, conditions have been compared to the record-breaking drought of 2011. To the far West, parts of the Big Bend region have received 600% of normal weekly rainfall in the last week, resulting in improvement from D1 to D0. The Edwards Plateau saw some rainfall, but it was not enough to improve the long-term regional dryness. Soil moisture and streamflows through the region continue to decline. Southern Oklahoma also felt the effects of low precipitation and high temperatures, resulting in widespread expansion of D0 and degradation of areas of D0 into D1.
In the High Plains, eastern parts of the High Plains saw the benefits of this week’s precipitation along with below-normal temperatures. Kansas saw heavy precipitation continue from last week, bringing further improvements to the east and central regions. Areas near Kansas City saw upwards of 3 inches of precipitation, while the southeast areas received 4 to 7 inches of rain, carrying over improvements seen in Oklahoma. Some improvements occurred along parts of the Nebraska-South Dakota border. Both southeast and northeast South Dakota saw improvement from heavy rainfall and improving soil moisture. This improvement bled over in southeast North Dakota, where areas of D0 were removed due to heavy precipitation. Little precipitation was received further north. Continual soil moisture and streamflow impacts led to D1 and D2 expansions. Southeastern Colorado received spotty precipitation, adding to the already-degrading conditions and resulting in expansion of D1 and D0.
In the West, much of the continental West remained status quo, with small improvements in central Utah and near Yellowstone National Park into Butte, Montana. Areas in The Helena-Lewis and Clak National Forest and in the east near Fort Peck Indian Reservation also saw improvements with the removal of D0 conditions. Northwestern Washington state saw continued above-normal temperatures, as high as 8 degrees above normal, and little measurable precipitation, resulting in slight expansion of D0-D2 from the Okanoga-Wenatchee National Forest to Puget Sound. The dry conditions experienced in Texas continued into New Mexico. Above-normal temperatures and below-normal precipitation in the eastern part of the state has led to further degradations, with the expansion of D1 near De Baca, Chaves and Lincoln counties. New Mexico has been on water restrictions for several months, with lake levels falling further below average.
Looking ahead, according to the Weather Prediction Center (WPC), during the next five days (Aug. 17-22, 2023), significant rainfall is expected across parts of the Southwest and California as Tropical Storm Hillary approaches the California-Mexico border. While the storm is expected to reach hurricane status, forecasts call for it to weaken before making landfall due to cooler ocean temperatures and land interactions. Rainfall totals of 2–4 inches with isolated areas over 6 inches are expected — a considerable amount of rain for the dry Southwest. Rain is also expected across the Northwest and northern Rockies. Much of the rest of the country looks to remain mostly dry, with the exception of Florida and the Gulf Coast. Meanwhile, a heat wave will build over the southern and central U.S. into the Midwest. Daytime highs are expected to be 10-20 degrees above normal in some places, equating to highs near 100 degrees in places such as the upper Midwest.
Moving into next week, the Climate Prediction Center’s 6-10 day outlook (valid Aug. 22-26, 2023) calls for an increased probability of above-normal temperatures throughout most of the Lower 48 states and much of Alaska. The only areas where below- or near-normal temperatures are favored include the Northeast, western Alaska and parts of the Southwest. Above-normal precipitation is favored across much of the western half of the U.S., parts of the Northeast, south Texas, South Florida and much of Alaska.
To view the 6-10 Day Precipitation Outlook Map, click here.
To view the 6-10 Day Temperature Outlook Map, click here.
To view the Monthly Drought Outlook Map, click here.


