

To view the Oklahoma Drought Map, click here.
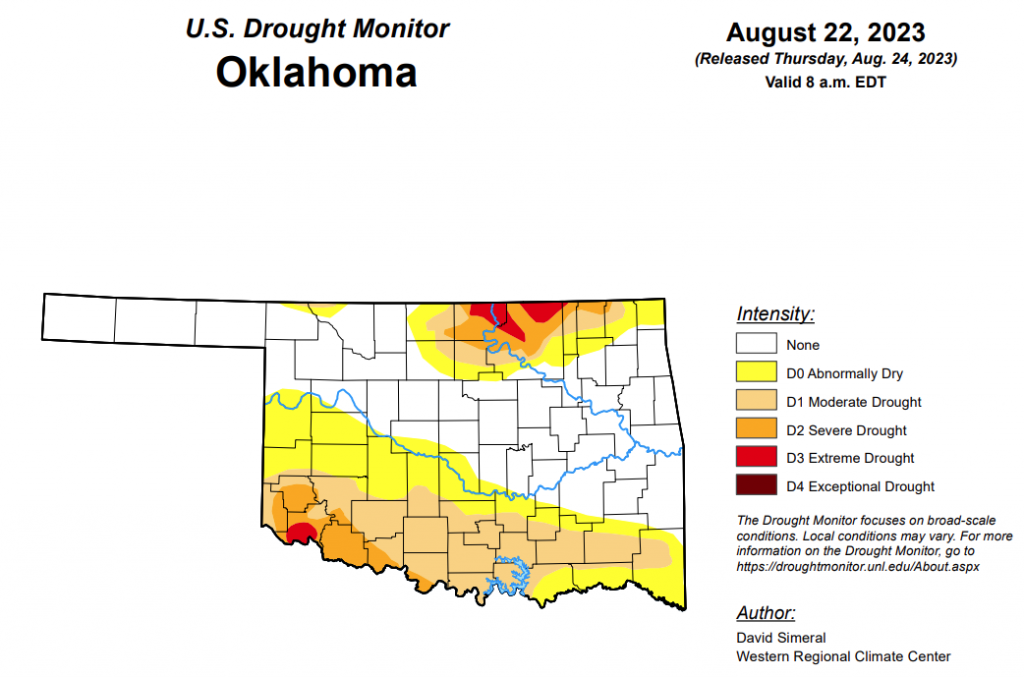
According to the latest Oklahoma Drought Monitor, exceptional drought remains at zero percent, unchanged for the past few weeks.
Extreme drought or worse has worsened just slightly from last week, moving from last week’s 1.60 percent to this week’s 1.69 percent.
Severe drought or worse has worsened, moving from last week’s 5.35 percent to this week’s 8.28 percent.
Moderate drought or worse has become significantly worse, moving from last week’s 12.75 percent to this week’s 28.14.
Abnormally dry or worse conditions have worsened quite a bit since last week, moving from last week’s 35.99 percent to this week’s 50.32 percent.
According to the 6 to 10-day precipitation outlook map, the left half of the panhandle is leaning below a 33 to 40 percent chance of precipitation through September 2. The rest of the state, aside from a large majority of northeastern Oklahoma, is leaning below 40 to 50 percent of precipitation. The northeastern part of the state and some surrounding counties are likely below a 50 to 60 chance of precipitation through September 2.

To view the United States Drought Map, click here.
According to the latest U.S. drought monitor, this U.S. Drought Monitor (USDM) week saw drought-related improvements on the map across southern portions of California and Nevada in association with the impacts of Tropical Storm Hilary, which made landfall in Southern California over the weekend and into Monday. The tropical storm, the first to make landfall in Southern California since 1939, brought record-breaking rainfall accumulations leading to widespread life-threatening flash flooding, mud and rockslides, and debris flows to parts of the region. Rainfall totals for the event ranged from 2 to 12 inches with the heaviest accumulations observed in higher elevations including the San Gabriel and San Bernardino Ranges, southern Sierra Nevada, Panamint Range in Death Valley National Park, and in the Spring Mountains near Las Vegas. In terms of the urban areas, the Los Angeles Basin received totals ranging from 2 to 5 inches, while the greater San Diego area received 1 to 3 inches and Palm Springs 2 to 4 inches. The rainfall led to removal of lingering areas of drought across the Mojave Desert and southern Nevada. In the Southwest, conditions in New Mexico saw statewide degradation on the map in response to a combination of both short- and long-term dryness across the state, including a weak monsoon season with 60-day rainfall deficits ranging from 2 to 6-inches. In the South, drought-related conditions have deteriorated rapidly during the past month across areas of Texas and Louisiana where persistent heat and rainfall shortfalls have led to drought expansion and intensification on the map this week. During the past two weeks, average maximum temperatures were 6 to 10+ degrees F above normal across Texas, southern Oklahoma, Louisiana, and southern Mississippi with reports of impacts related to human health as well as severe impacts to agriculture, vegetation health, and surface water conditions. Looking at the latest climatological data released by NOAA NCEI (through July 2023), Louisiana Climate Division 7 (Southwest Louisiana) observed its warmest May-July period on record, while Texas Climate Division 8 (Upper Coast) experienced its warmest June-July period on record. In the Midwest, continued areas of dryness led to degradations in portions of Minnesota, Iowa, and Wisconsin. In the Eastern Tier, some minor deterioration in drought-related conditions occurred in areas of the Carolinas as well as in the Panhandle of Florida.
In the Southern Plains, in the South, drought-related conditions continued to deteriorate as the hot and dry pattern continued across most of the region. Many impact reports came in this week emphasizing the rate at which the impact of the persistent heat is taking its toll. In both Louisiana and areas of Texas, numerous impacts are being observed including declining soil moisture, poor vegetation health, impacts within the agricultural sector, and poor surface and groundwater conditions. The combination of these factors led to expansive deterioration on the map in areas of Texas, Louisiana, and southern Oklahoma including expansion of areas of Extreme Drought (D3) and the introduction of Exceptional Drought (D4). For the week, average temperatures across the region were above normal with Louisiana, Oklahoma, and Texas observing temperatures ranging from 4 to 10+ degrees F above normal. Conversely, temperatures were near to slightly below normal across northern portions of Arkansas, Mississippi, and Tennessee. In terms of precipitation, the region was very dry except for some isolated areas of South Texas and southeastern Louisiana which received light accumulations.
In the High Plains, on this week’s map, no changes were made across the Plains states while some minor improvements were made in northwestern Wyoming and some degradations in south-central Colorado. Across the Plains, hot and dry conditions prevailed across much of the region this week with well-above normal temperatures (2 to 8 degrees F) observed, except for areas of the Dakotas where temperatures were a few degrees below normal. In terms of the overall drought situation, the past 60-day period has been marked with some improvements in response to above-normal precipitation across areas of Kansas and Nebraska. However, the longer-term dry signal has remained intact across areas of the region and continues to be reflected in various drought indicators including soil moisture and streamflow levels.
In the West, on the map, widespread improvements were made in drought-affected areas of southern California and Nevada in response to heavy rainfall accumulations associated with Tropical Storm Hilary and its remnant moisture that pushed northward across the Mojave Desert, Great Basin, and into the Pacific Northwest. The severe weather event helped to eliminate areas of lingering drought on the map across the Mojave Desert and in areas of southern Nevada. Likewise, conditions improved on the map in west-central Idaho and northeastern Oregon in response to this week’s rainfall. Conversely, continued dryness and below-normal streamflow activity led to an introduction of Extreme Drought (D3) in the Northern Rockies around Glacier National Park where streamflows on the North Fork of the Flathead River at Columbia Falls, Montana were in the 4th percentile. In north-central Montana, areas of Severe Drought (D2) expanded on the map due to a combination of factors including dry soils and below-normal precipitation during the past 60-day period. In the Four Corners states, the poor monsoon season and related precipitation shortfalls led to introduction of areas of Moderate Drought (D1) in southern and central Arizona as well as in south-central Colorado in the San Luis Valley. In New Mexico, the combination of short- and long-term precipitation deficits, poor soil moisture, and rangeland conditions led to widespread deterioration on the map across much of the state.
Looking ahead, the NWS WPC 7-Day Quantitative Precipitation Forecast (QPF) calls for light-to-moderate precipitation accumulations ranging from 1 to 3+ inches across portions of the Four Corners states as well as areas of Far West Texas. Likewise, similar accumulations are expected across areas of the Southeast, Mid-Atlantic, and the Northeast. In the eastern and northern portions of the Midwest, lighter accumulations (< 1 inch) are forecasted. The CPC 6-10Day Outlooks call for a moderate-to-high probability of above-normal temperatures across much of the conterminous U.S. including the West, South, Southeast, Plains states, and western portions of the Midwest. Conversely, below-normal temperatures are expected across the Lower Midwest, Mid-Atlantic, and the Northeast. In terms of precipitation, below-normal precipitation is expected across the Plains states, Midwest, and far western extent of the Northeast, while above-normal precipitation is forecasted for much of the western U.S. and across much of the Eastern Seaboard.
To view the 6-10 Day Precipitation Outlook Map, click here.
To view the 6-10 Day Temperature Outlook Map, click here.
To view the Monthly Drought Outlook Map, click here.


