

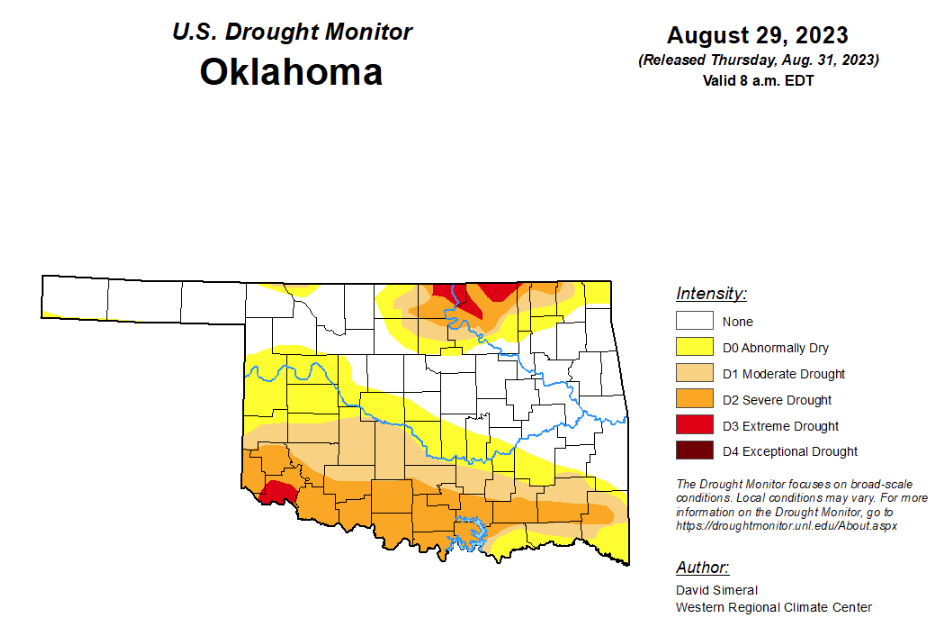
To view the Oklahoma Drought Map, click here.
According to the latest Oklahoma Drought Monitor, exceptional drought remains at zero percent, unchanged for the past few weeks.
Extreme drought or worse is now at 1.97 percent, up from last week’s 1.69 percent.
Severe drought or worse is now at 19.70 percent, up significantly from last week’s 8.28 percent.
Moderate drought or worse is also up from last week, now at 35.98 percent- last week’s percentage was 28.14.
Abnormally dry or worse conditions have worsened since last week and are now at 58.27 percent, up from last week’s 50.32 percent.
According to the 6 to 10-day precipitation outlook map, the majority of the panhandle is leaning below a 40 to 50 percent chance of precipitation through September 9. The northeast part of the state, dipping down into the southeastern border, stands at a near-normal chance of precipitation through that date. The remaining parts of the state are leaning below a 33 to 40 percent chance of precipitation through that September 9 date.
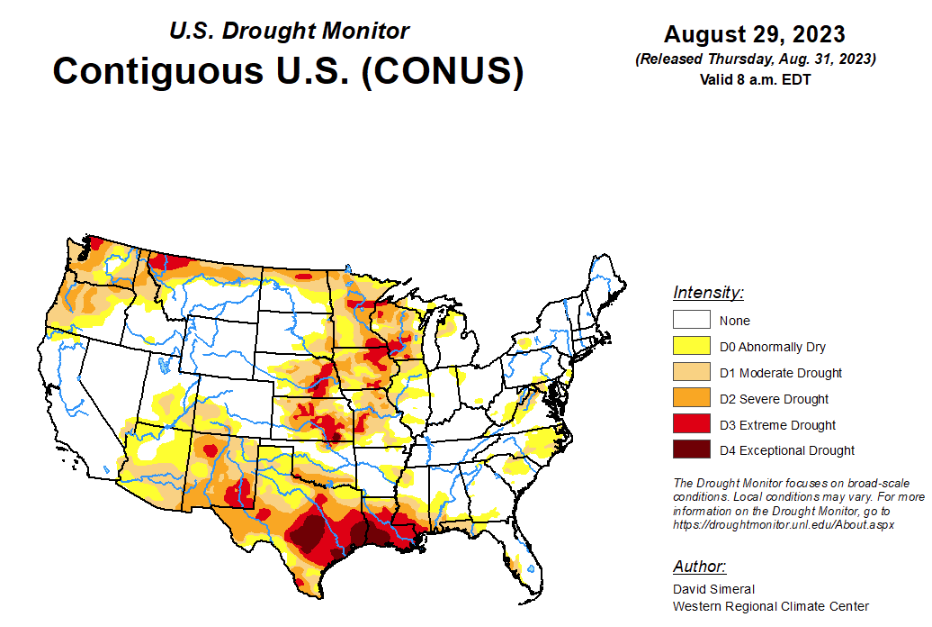
To view the United States Drought Map, click here.
According to the latest U.S. drought monitor, this week saw continued intensification of drought across areas of the Midwest, South, Southwest, and the Pacific Northwest. In the Midwest, extreme heat impacted areas of the region including Minnesota, Iowa, Missouri, Wisconsin, and Illinois with temperatures soaring 6 to 10+ degrees F above normal. Daily high temperature records were broken across the region during the past week including in Chicago (98), Milwaukee (101), Minneapolis (101), and Des Moines (100). Similarly, areas of the South including the northern Gulf Coast of Texas, Louisiana, and southern Mississippi saw continued drought-related deterioration on this week’s map as the heatwave continued to push high temperatures over 100 degrees F with numerous records broken during the past week. Record daily highs were set or tied in various southern cities including Houston (109), San Antonio (104), Austin (107), Dallas (109), Baton Rouge (106), New Orleans (103), Jackson (106), and Mobile (101). In Louisiana and southern Mississippi, the continued hot and dry conditions have led to numerous wildfire outbreaks as well as widespread poor hydrologic conditions and severe impacts within the agricultural sector. In the Southwest, monsoon precipitation has been well below normal across much of the region with areas of southern Arizona and New Mexico reporting rainfall deficits ranging from 3 to 6 inches since the beginning of July. In the Pacific Northwest, areas of drought expanded on the map in Oregon, Washington, and Montana in response to a combination of above-normal temperatures over the past 90-day period, precipitation shortfalls, and poor surface water conditions. Conversely, some areas saw improved drought-related conditions on the map, including southern Texas where heavy rains, in association with Tropical Storm Harold last week, provided much-needed moisture to the region. Rainfall accumulations along the southern Gulf Coast and South Texas Plains regions ranged from 2 to 6 inches. In the Southeast, areas of Florida braced themselves for the impacts of Hurricane Idalia as it intensified rapidly early this week. The hurricane made landfall in the Big Bend region of Florida early Wednesday morning (8/30) as a dangerous Category3 hurricane bringing a life-threatening storm surge, catastrophic winds, and severe flooding.
In the Southern Plains, the heatwave continued across the region during the past week with record-breaking temperatures observed across the eastern half of Texas, Louisiana, and Mississippi. On the map, areas of Extreme Drought (D3) and Exceptional Drought (D4) expanded along the northern Gulf Coast of Texas and Louisiana as well as areas of Severe Drought (D2) and Extreme Drought (D3) in southern Mississippi. According to the latest U.S Department of Agriculture (USDA) Weekly Weather and Crop Progress Bulletin (8/29), the percentage of topsoil in Texas rated short to very short was 92%, while neighboring Louisiana was rated 88% short to very short. In addition, Water Data for Texas was reporting (8/30) reservoirs in the Edwards Plateau Climate Division were 35.9% full, while the South-Central Climate Division reservoirs were 44.2% full. In terms of drought-related impacts, the National Drought Mitigation Center’s Condition Monitoring Observer Reports (CMOR) were reporting hundreds of impact reports from across Louisiana and Mississippi during the past 30 days. For the week, average temperatures across the region were well above normal across most of the region with temperature departures ranging from 2 to 10+ degrees F above normal. In terms of precipitation, the region was generally very dry except for some isolated areas of light to moderate accumulations observed in areas of Texas (East Texas, Trans-Pecos), Louisiana, and southern Mississippi. In South Texas, some locally heavy rainfall was observed in association with Tropical Storm Harold making landfall and providing beneficial rainfall to drought-affected areas.
In the High Plains, on this week’s map, degradations were made in northern portions of North Dakota and in eastern Kansas. Conversely, recent precipitation during the past 30-60-day period led to some minor improvements on the map in drought-affected areas of southeastern Nebraska. Across most of the Plains, hot and dry conditions prevailed this week except for some isolated shower activity along the Kansas-Nebraska border region where 1 to 3 inches were observed. Average temperatures for the week were well above normal (2 to 8 degrees F) with the greatest departures observed in northwestern North Dakota and eastern portions of Nebraska and Kansas.
In the West, on the map, degradations were made across areas of the Southwest and Pacific Northwest including New Mexico, Oregon, Washington, and Montana. In the Pacific Northwest, an area of Extreme Drought (D3) was added in the North Cascades where precipitation has been below normal both in the short and long term. Moreover, 7-day average streamflows on numerous creeks and rivers were below the 10th percentile and numerous other drought indices were supporting deterioration in the Cascades as well as other areas in the state. Likewise, poor soil moisture and low streamflow levels led to expansion of Extreme Drought (D3) in northwestern Montana. In New Mexico, the combination of short- and long-term precipitation deficits, poor soil moisture, and impacts in the agricultural sector (eastern New Mexico) led to continued deterioration on the map across parts of the state. For the week, some light precipitation accumulations (generally < 1 inch) were observed in isolated areas of the Four Corners states and Intermountain West.
Looking ahead, the NWS WPC 7-Day Quantitative Precipitation Forecast (QPF) calls for heavy precipitation accumulations ranging from 4 to 10+ inches in association with impacts of Hurricane Idalia, which is forecast to bring very heavy rains across the Big Bend region of Florida as well as across areas of the Coastal Plain of Georgia and the Carolinas. In the Northeast, dry conditions are expected, while most of the South, Midwest, and the Plains states are forecasted to experience generally dry conditions. In the West, some light to moderate accumulations ranging from 1 to 3 inches are expected across portions of Arizona, Utah, and in isolated areas of the central and northern Rockies. The CPC 6-10 Day Outlooks call for a moderate-to-high probability of above-normal temperatures across much of the conterminous U.S. in an area extending from the Rocky Mountains to the Eastern Seaboard, while near-normal temperatures are expected over the remainder of the West except in Washington state where temperatures are forecasted to be below normal. In terms of precipitation, below-normal precipitation is expected across much of the southern tier of the conterminous U.S. as well as portions of the Mid-Atlantic, Great Basin, and Intermountain West. Meanwhile, above-normal precipitation is forecasted for areas of the Upper Midwest, Northern Plains, and the Pacific Northwest.
To view the 6-10 Day Precipitation Outlook Map, click here.
To view the 6-10 Day Temperature Outlook Map, click here.
To view the Monthly Drought Outlook Map, click here.


