

September’s World Agricultural Supply and Demand Estimates, released Sept. 12, is the first of the season to incorporate objective yield plot results for corn, soybeans and cotton (outside of Texas) as collected for the National Agricultural Statistics Service’s (NASS) Crop Production report. This Market Intel also looks at production and demand adjustments in livestock and poultry in response to changes in cattle inventory, and hatchery data.
Compared to the August WASDE report, U.S. corn and rice supplies are loosening, U.S. soybean and cotton supplies are tightening, and while domestic wheat supply is staying the same, globally it’s tightening.
Crops
Corn
For the 2023/24 marketing year that started Sept. 1, USDA indicates that corn farmers planted 772,000 more acres of corn than what was reported in the June 30 Acreage report, pushing corn area planted to 94.9 million acres, up 7.1% compared to 2022.
As expected, yield projections decreased by 1.3 bushels per acre from August’s report to 173.8 bushels per acre, falling 0.74%. Despite poor crop conditions — the lowest rating of good-to-excellent corn for this point in the season since 2012 — overall yield is still currently projected to be the fifth-highest on record. In the objective yield surveys, NASS found that there were a record number of ears per acre in the fields. So, despite tough conditions making smaller ears and less kernels per ear, yields are being buoyed by record-high ear counts.
Overall U.S. corn production is forecasted to nudge up from the previous month, rising to 15.134 billion bushels (+0.15%, 23 million bushels), driven by the increase in acreage estimates.
On the demand side, projections for the 2023/24 U.S. corn crop were unchanged month-over-month. The increase in 2023/24 production was offset slightly by a decrease in 2022/23 ending stocks caused by a month-over-month increase in old crop exports. Ending stocks were forecasted up 19 million bushels to 2.2 billion bushels (+0.86%). With overall limited movement, the projected average farm price for corn remained the same at $4.90.
Soybeans
Like corn, projected yields for soybeans were also reduced for the 2023/24 marketing year, lowered by 0.8 bushels to 50.1 bushels per acre (-1.6%). The lower yields were slightly offset by a small increase in planted acres, but the extra acreage didn’t make up the entire gap, which led to a projected reduction of 59 million bushels of soybean production, a 1.4% decrease from the August WASDE report forecast.
Projected 2023/24 domestic use was also reduced, led by a drop of 1.9% in projected exports (35 million bushels) as compared to the August report. These factors, combined with a reduction in the old crop ending stocks led to one of the biggest surprises in this report. USDA projected a decrease in this year’s ending stocks, which are estimated to end at 220 million bushels, a 10.2% reduction month-over-month and 12% lower than 2022 estimates. That leaves the soybean market on track to have a 5.2% stock-to-use ratio, which would be the lowest since 2015. The projected 2023/24 average farm price was projected at $12.90. This represents a 20-cent increase over the August report, and an 80-cent increase since the first estimate in May. Despite these increases, this projection is still down $1.30 (3.2%) in comparison to the 2022/23 season.
Despite these slightly bullish adjustments, futures markets responded negatively with the November contract closing at $13.46 per bushel on the day of the release, or down 22 cents. This may be in response to the fact that Brazil, the biggest competitor to U.S. soy production, is expected to have another monster corn and soybean crop coming down the pipe.
Rice
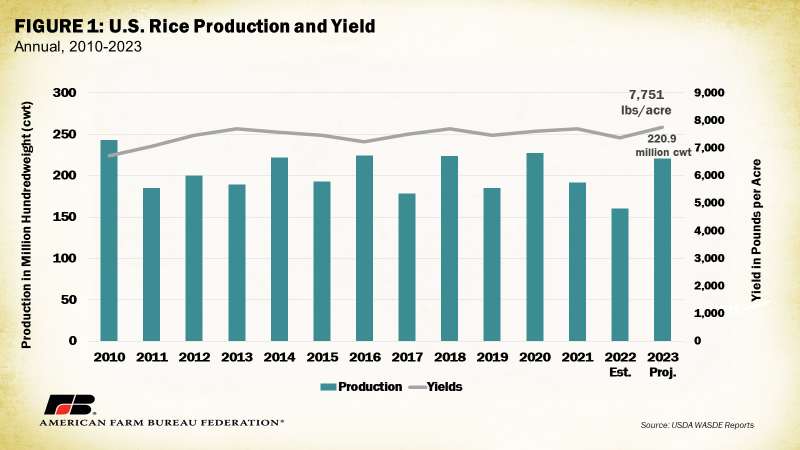
Domestically, U.S. rice is now projected to have a record yield during the 2023/24 season, increasing 52 pounds per acre to 7,751 pounds per acre from the August report. Like corn and soybeans, rice acres were also increased from previous reports, jumping 210,000 acres, or 7.8%, to 2.9 million. That large increase is indicative of a strong recovery from the water supply issues that plagued the 2022/23 season and resulted in historically low acreage last year. The current year-over-year forecast shows this trend continuing, with an increase of 30.6% (680,000 acres) anticipated.
If record yields come to fruition, they will lead to the eighth-largest rice crop since 1983, at 220.9 million hundredweight.

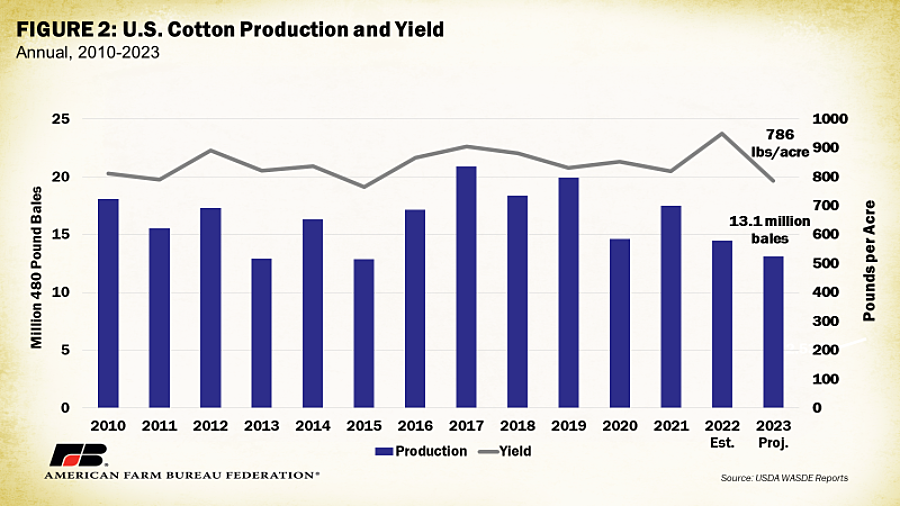
Of the crops covered in this analysis, cotton was the only one with a decrease in projected acreage, dropping 854,500 acres (7.7%) from previous reports to 10.2 million planted acres. Because of the decline in acre estimates, production was also revised down 6.1% to 13.1 million 480-lb bales. If these trends continue, both yield and production will be the lowest since 2015, as demonstrated in Figure 2.
The drop in production is mostly offset by an unexpected increase in both the 2022 and 2023 beginning stock estimates, putting 2023/24 estimated ending stocks down -0.3% to 3 million bales. Subsequently, season-average prices for upland cotton increased by 1 cent above the August report to 80 cents per pound.
Wheat
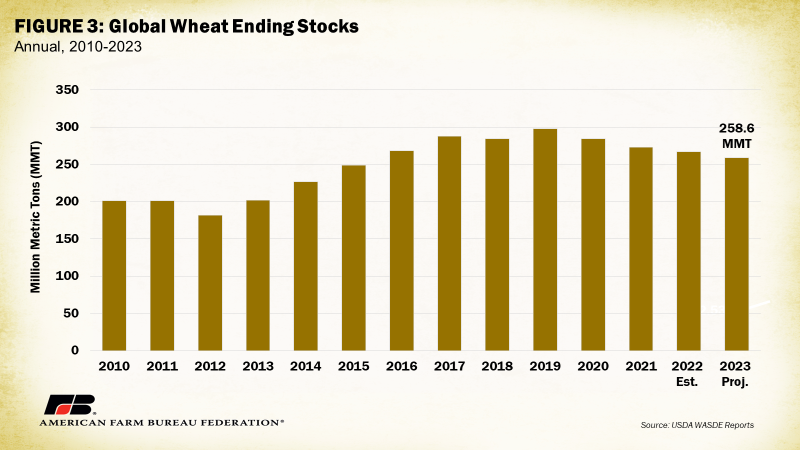
With winter wheat harvest completed and spring wheat 87% harvested, the U.S. all wheat supply and use projections were unchanged. However, 2023/24 global supply estimates were lowered by 7.2 million metric tons (MMT) to 1,054.5 MMT, a decrease of 0.7%. Declines in supplies are driven predominantly by significantly lower production in Australia (-3 MMT, -13.7%) due to higher-than-normal dryness caused by El Niño, in addition to smaller declines in Canada, Argentina the European Union. Notably, the 2023/24 wheat season is no longer projected as a record wheat crop and is forecasted to be the first year-over-year production decline since the 2018/19 marketing year.
With minor changes in demand, world ending stocks estimates were also lowered 7 MMT to 258.6 MMT since the August report. If realized, this would be the lowest ending stock since 2015, as demonstrated in Figure 3.

Livestock and Poultry
Cattle
On the livestock side, a fresh set of USDA supply/demand estimates lowered production forecasts for beef, pork, and poultry in 2023. Overall, changes made in this report slightly reduced both supply and demand forecasts for red meat and poultry. Total beef supplies for 2023 were reduced by 1.1 million pounds from 2022 or 3.5%. Lower cattle supplies from continued herd liquidation are largely responsible for this change. Beef demand for 2023 is reduced by 551 million pounds or about 2%. USDA increased third quarter steer price projections by $5 per cwt to $179.02, or 2% from August, and by another $6 per cwt, or 3%, from August, in quarter four. 2024 beef demand was reduced by 1.6 million pounds, or 6%, from 27.6 million pounds in 2023 to 25.9 million pounds in 2024. This likely reflects an expected change in consumer preference in 2024 in response to higher beef prices.
Pork
Pork production was lowered slightly from 2022 mostly due to lighter than expected carcass weights and slowed slaughter pace. Demand for pork is projected to increase slightly by 55,000 pounds. Pork exports were lowered by 125,000 pounds, or about 2% from August, but remain 7% higher than 2022. Mexico is currently the leading importer of U.S. pork in 2023 with 446.1 thousand metric tons in export sales accumulated as of Sept. 8, 2023.
Poultry
2023 broiler production and demand estimates were both reduced slightly from August. 2023 production was estimated at 46.19 billion pounds, down slightly from August and 483 million pounds, or about 1%, below 2022. Demand was estimated to be 39.06 billion pounds, down only slightly from August or 2% below 2022. Price projections reflect the drop in demand. USDA estimates prices for the second half of 2023 to average $1.145 per pound, about 13% lower than the second half of 2022.
Turkey production estimates for 2023 are unchanged from last month at 5.7 million pounds. This reflects a 7%, or 356,000-pound, increase from 2022 when Highly Pathogenic Avian Influenza (HPAI) decimated turkey flocks throughout the U.S. 2023 turkey price projections were $1.35 per pound for quarter three and $1.36 per pound in quarter four. Price projections for the fourth quarter of 2023 are 25% lower than they were in 2022 and reflect a decrease in demand for turkey.
USDA projects egg prices to increase by 3 cents per dozen in quarter three, and by an additional 21 cents per dozen in quarter four. These price increases come from a 57.5-million-dozen decrease in production from hatchery data that will be released on Wednesday September 13 at 3:00 pm Eastern time. While fourth quarter prices are projected to increase, the $1.60 estimate is 257% lower than the $4.11 per dozen prices in the fourth quarter of 2022.
Happy 50th Birthday to the WASDE Report!
We conclude this Market Intel with a brief history lesson. This most recent WASDE represents 50 years of WASDE reports, though not always under the same name. While USDA crop statistics date back to 1863, the direct predecessor of WASDE was introduced on Sept. 17, 1973, as Agricultural Supply and Demand Estimates. The report was later renamed World Agricultural Supply and Demand Estimates in 1980 and added reports on individual foreign markets in 1985.
The WASDE was created in response to The Great Grain Robbery of 1972, when the Soviet Union was able to purchase an immense amount of wheat at low prices subsidized by the U.S. government. At the time of negotiations, the U.S. had not realized that a massive drought in the Soviet Union was leading to crop failure. After the grain deal was complete and the extent of the Soviet crop failure became known, prices skyrocketed.
Since its introduction, the WASDE has provided transparency and insights into agricultural markets, where global supply and demand are constantly changing, putting everyone involved in the market on a more equal playing field.


