| Transition to El Niño Weather Pattern Likely Helped Birds By Tell Judkins, Upland Game Biologist The Oklahoma Department of Wildlife Conservation (ODWC) has conducted annual roadside quail surveys in August and October since 1990 to provide an index of annual population fluctuations. The number of quail observed are reported to provide an index of quail abundance and an indicator of reproductive success. ODWC employees surveyed 81 routes in 75 of Oklahoma’s 77 counties. Oklahoma and Tulsa counties, both almost exclusively urban landscapes, are excluded from the survey. The state is divided into either geographic regions (Figure 1) or ecoregions (Figure 11) to compare the index year to year. By looking at both, biologists can get a more precise view of on-the-ground conditions in each county, and hunters can get a better glimpse into the county they intend to hunt. The 2023 August roadside quail survey shows the statewide quail index up 45.8 percent from 2022, climbing from 1.53 to 2.23 quail per route (q/r) which is 55.6 percent below the 34-year average (Table 1 and Figure 2), and 28.3 percent below the 10-year average of 3.11. There are several theories as to what has caused population decline, but it is primarily attributed to habitat loss and weather. Age structure of observed birds shows 65.2 percent full-grown, 10.5 percent three-fourths-grown, 17.7 percent half-grown, and 6.6 percent one-fourth-grown birds. This age structure indicates successful early broods with females still nesting throughout the season. Last fall, the latest known hatch was documented from the wing-box program with a harvested bird hatching out around Sept. 19 in the northcentral region. If favorable weather patterns continue into fall, it could lead to even better numbers in October’s survey. Additionally, ODWC biologists have received several reports of broods of varying ages throughout summer. All regions of the state except the northcentral region improved from the 2022 survey. All regions, other than the northeast region, are currently well below their historical 34-year average (Figures 3-8). The past winter was fairly mild for Oklahoma, with only a few major systems that dropped temperatures below average, with the last major cold front arriving in early March. After three consecutive years of La Niña (warmer/dryer) weather patterns, this spring saw a transition to an El Niño (cooler/wetter) pattern, which generally ties to better quail numbers. One year ago, 100 percent of Oklahoma was in some level of drought, with over 94 percent being in D2 (severe), D3 (extreme) or D4 (exceptional) drought conditions. Currently, about 58 percent of the state is in drought, with less than 20 percent in D2-D4 conditions. Rainfall throughout the growing season has been an example of feast or famine, coming at times in monsoon-like systems dumping several inches at a time and bringing hail along with it. Precipitation in May and June produced good conditions; by mid-August, 64 percent of the state was drought-free. Summer heat and a lack of rain in late August allowed drought to steadily take hold again. Figures 9 and 10 show drought and rainfall conditions across the state. Over the past 180 days, about half of Oklahoma has seen normal rainfall, but the previous 30 days show much of the state well below normal in rainfall with some areas in the southern half only seeing about 1 percent of normal rainfall. Dense vegetation along roadsides in some areas could contribute to fewer quail observations. When considered by ecoregion, survey results can provide a better look at bird numbers. Figure 11 shows the nine major ecoregions of Oklahoma. Table 2 compares 2022 and 2023 survey results by ecoregion. One scaled quail was observed during the 2023 August survey. Only a few routes in Oklahoma offer the opportunity to observe scaled quail. Therefore, this is not a prediction of scaled quail abundance, strictly an observation. ODWC has received several reports of scaled quail broods in the Oklahoma Panhandle this year. Anecdotally, ODWC has received numerous brood reports in August. Over the past 34 years, the August roadside surveys have shown that they are not always the most reliable when it comes to forecasting the season. Stay tuned for the October roadside surveys and 2023 Season Outlook, which will provide a better indication of what the upcoming quail season could have in store. Oklahoma’s quail season will open Nov. 11 and close Feb. 15, 2024. The bag limit remains 10 quail daily. For more regulations and other information, consult the Oklahoma Fishing and Hunting Regulations at wildlifedepartment.com/hunting/regs or in print wherever hunting and fishing licenses are sold. |
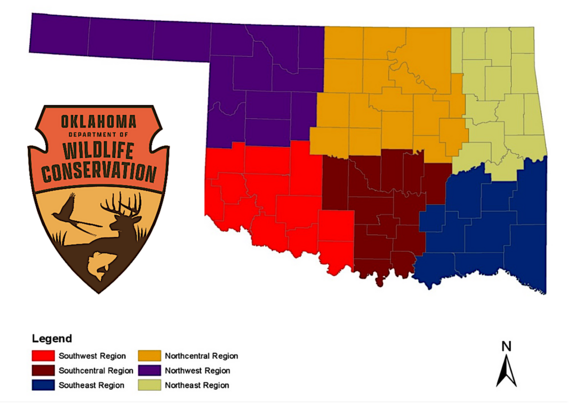 Figure 1. Oklahoma Roadside Survey Regions Figure 1. Oklahoma Roadside Survey Regions |
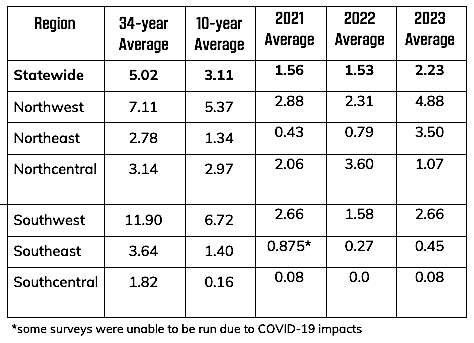 Table 1. Bobwhite quail observations/20-mile route by geographic region in Oklahoma. Table 1. Bobwhite quail observations/20-mile route by geographic region in Oklahoma. |
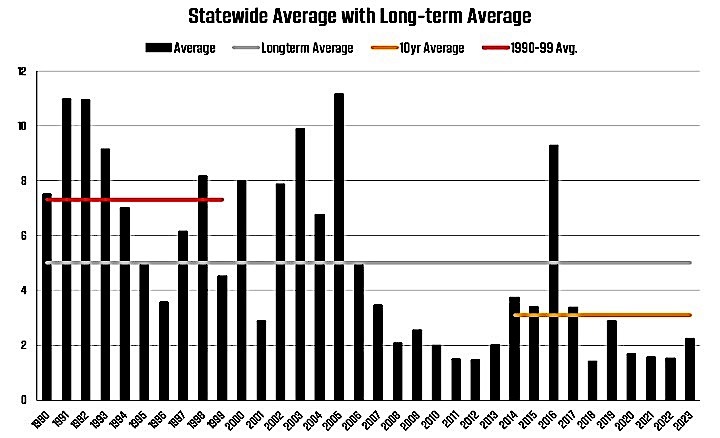 Figure 2. Long-term average of bobwhite observations in Oklahoma. Figure 2. Long-term average of bobwhite observations in Oklahoma. |
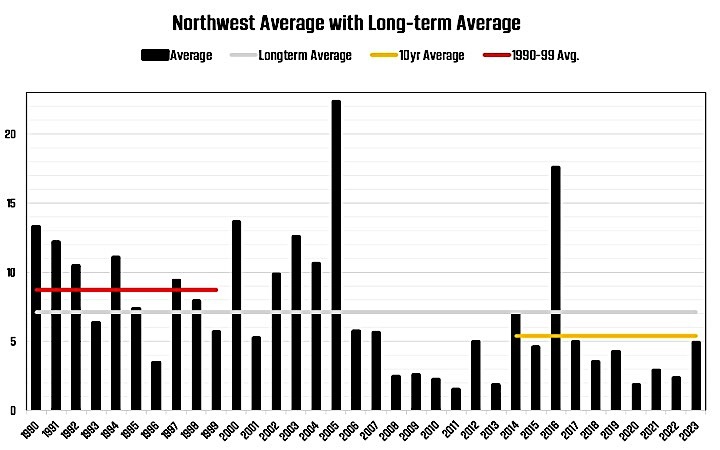 Figure 3. Long-term average of bobwhite observations in northwest Oklahoma. Figure 3. Long-term average of bobwhite observations in northwest Oklahoma. |
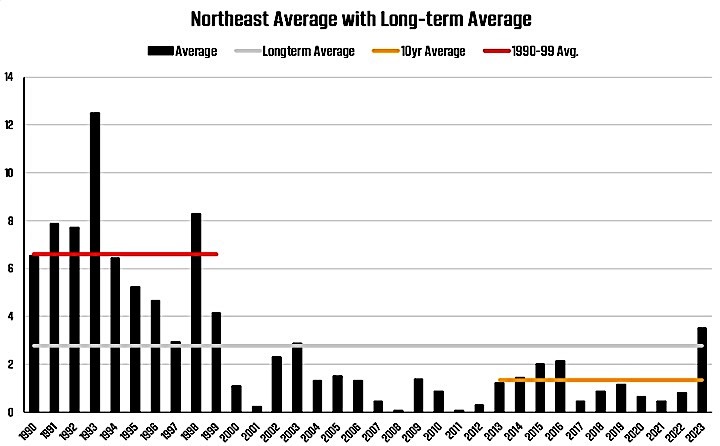 Figure 4. Long-term average of bobwhite observations in northeast Oklahoma. Figure 4. Long-term average of bobwhite observations in northeast Oklahoma. 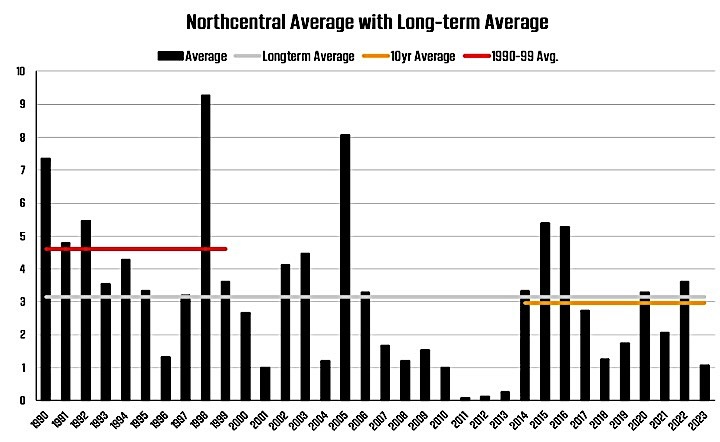 Figure 5. Long-term average of bobwhite observations in northcentral Oklahoma. Figure 5. Long-term average of bobwhite observations in northcentral Oklahoma. 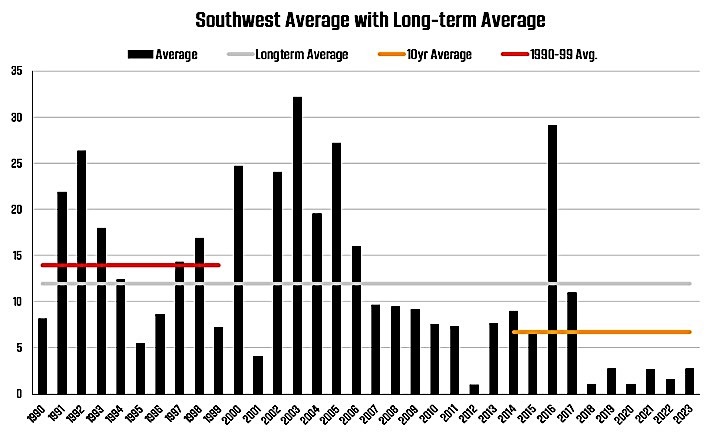 Figure 6. Long-term average of bobwhite observations in southwest Oklahoma. Figure 6. Long-term average of bobwhite observations in southwest Oklahoma. 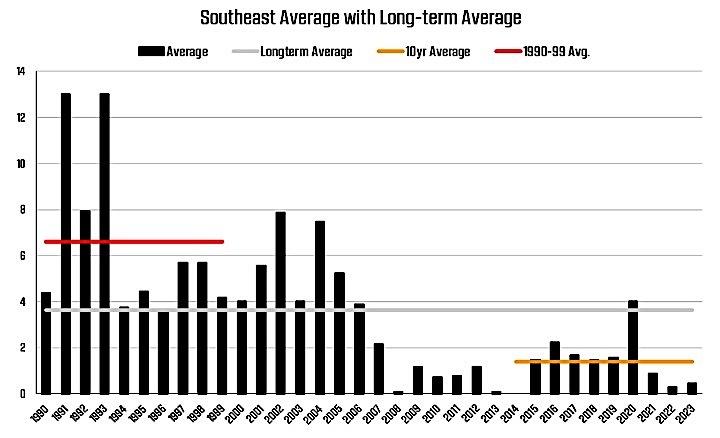 Figure 7. Long-term average of bobwhite observations in southeast Oklahoma. Figure 7. Long-term average of bobwhite observations in southeast Oklahoma. 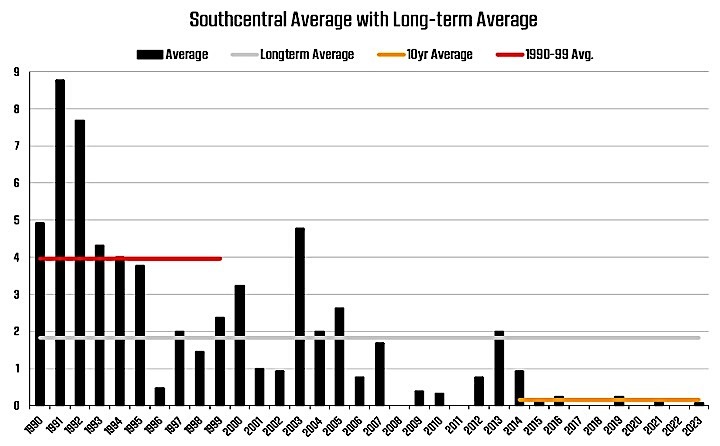 Figure 8. Long-term average of bobwhite observations in southcentral Oklahoma. Figure 8. Long-term average of bobwhite observations in southcentral Oklahoma. 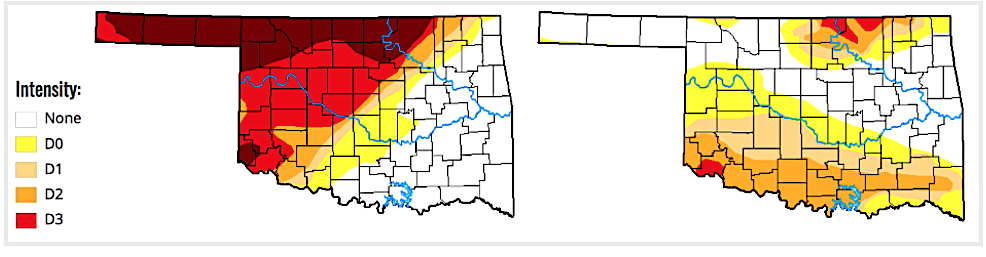 Figure 9. Drought Comparison from April 18th, 2023, to August 31st, 2023 (Source: droughtmonitor.unl.edu/) Figure 9. Drought Comparison from April 18th, 2023, to August 31st, 2023 (Source: droughtmonitor.unl.edu/) 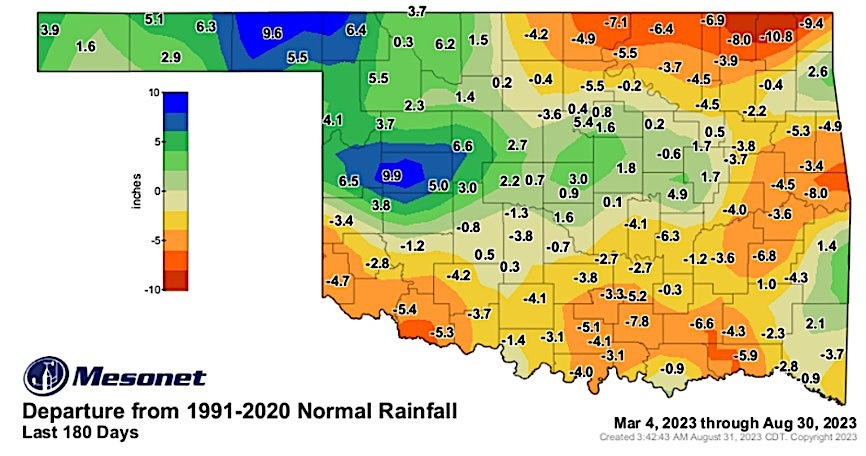 Figure 10. Departure from normal rainfall in inches: March 4 – August 30, 2023 (Source: mesonet.org) Figure 10. Departure from normal rainfall in inches: March 4 – August 30, 2023 (Source: mesonet.org) 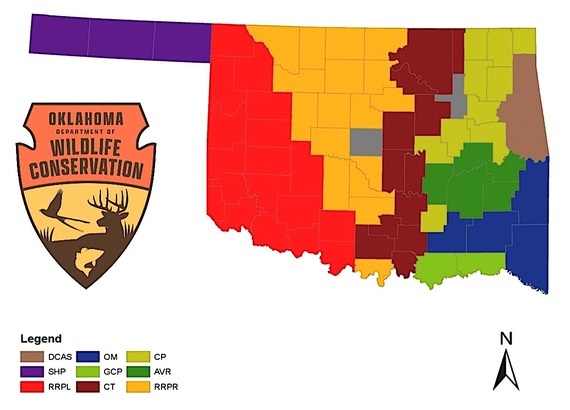 Figure 11. Ecoregions of Oklahoma Figure 11. Ecoregions of Oklahoma 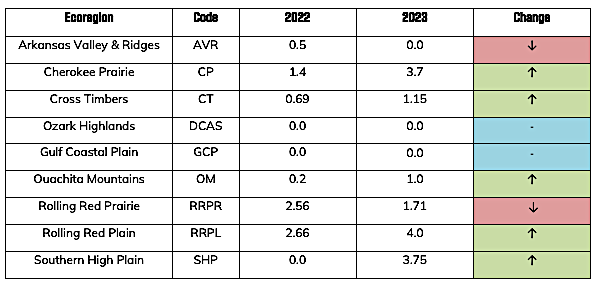 Table 2. Bobwhite quail numbers/20-mile route in the 9 geographic ecoregions of Oklahoma Table 2. Bobwhite quail numbers/20-mile route in the 9 geographic ecoregions of Oklahoma |