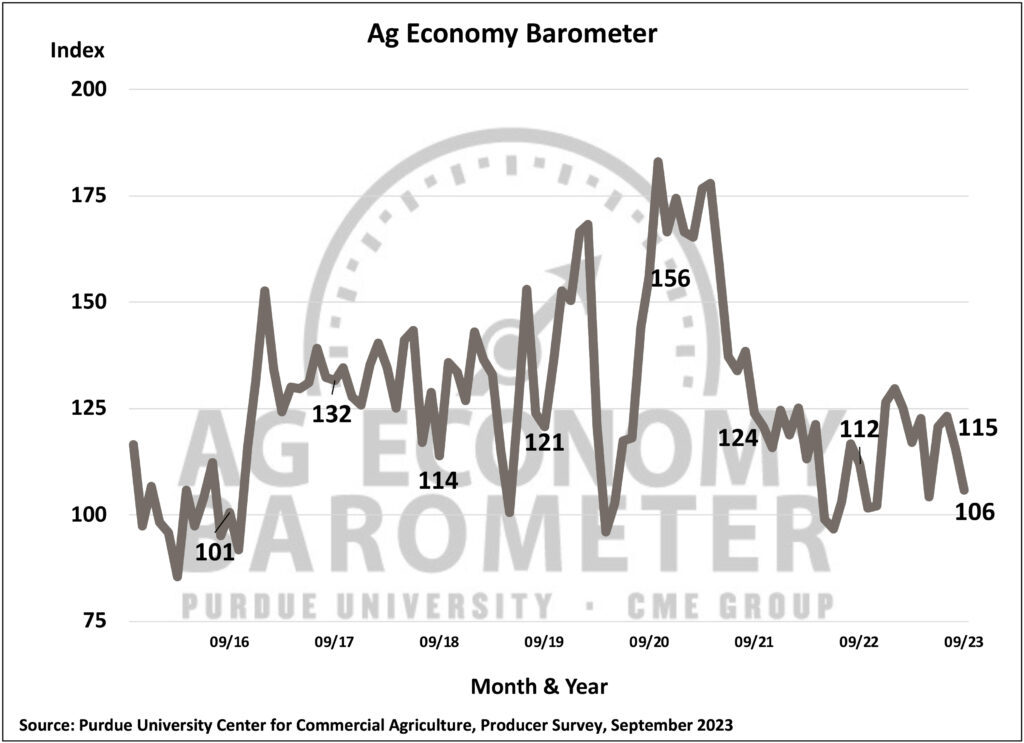
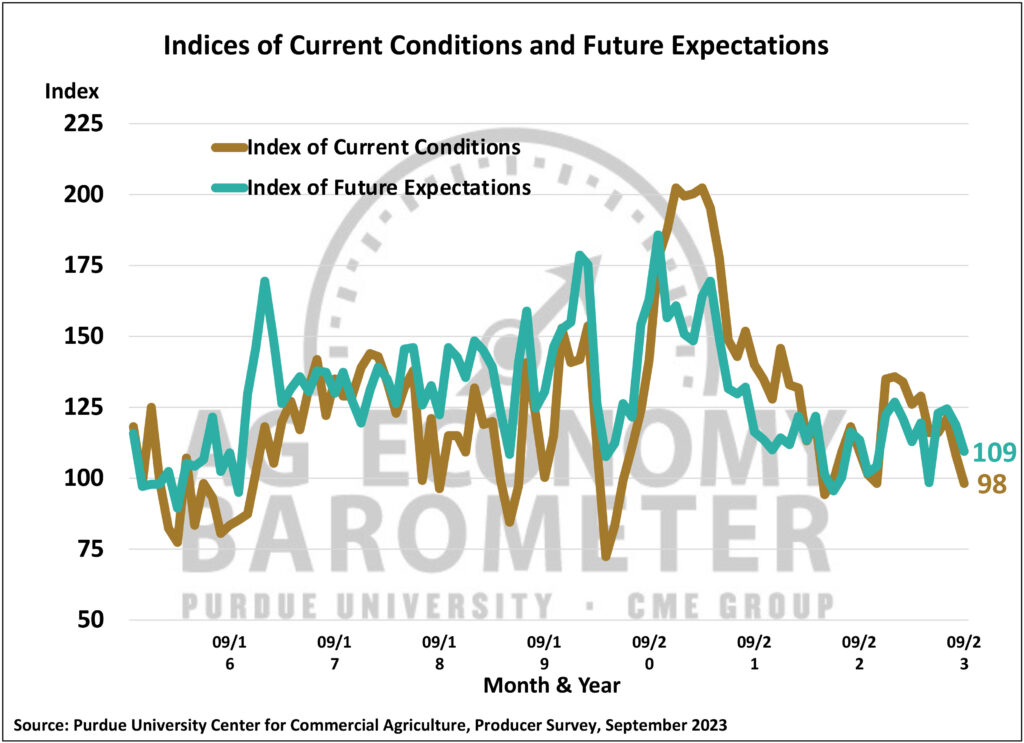
Agricultural producers’ sentiment declined for the second month in a row during September as the Purdue University-CME Group Ag Economy Barometer fell 9 points to a reading of 106. Producers expressed concern about both their current situation as well as future prospects for their farms. The Current Conditions and Futures Expectations Indicesboth declined 10 points in September leaving the Current Conditions Index at a reading of 98 while the Future Expectations Index stood at 109. Weakening prices for major crops and ongoing concerns about high production costs and interest rates weighed on producers’ minds this month. September’s declines left all three indices below year-ago levels. This month’s Ag Economy Barometer survey was conducted from September 11-15, 2023.
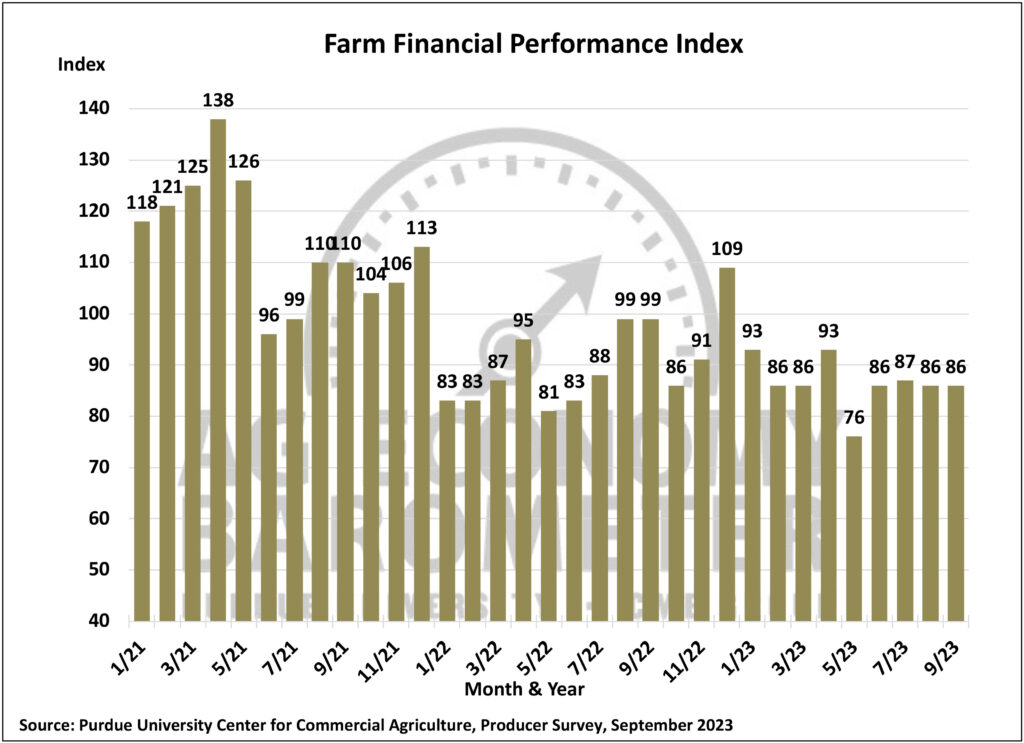
The Farm Financial Performance Index was unchanged in September compared to August, leaving the index at a reading of 86. Although the index didn’t change, there was a shift in responses to the question the index is based upon, with fewer producers reporting that they expect financial performance to be about the same as last year. In a nod to how variable conditions have been around the country this growing season, there were small increases in the percentages of producers who 1) expect better conditions and 2) expect worse financial conditions compared to last year.
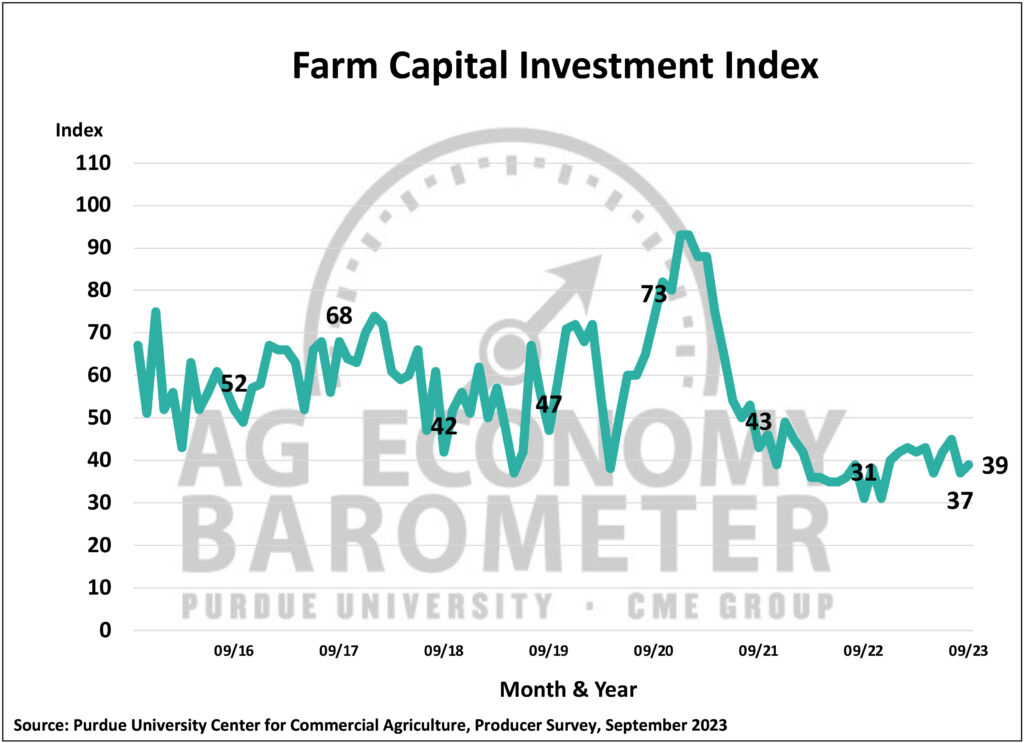
There was a small uptick in the Farm Capital Investment Index, which rose from a reading of 37 in August to 39 in September. The increase resulted from a slight rise in the percentage of producers who said now is a good time to make investments. However, three-fourths of the producers in this month’s survey still said it’s a bad time for large investments, pointing to the high cost of machinery and new construction along with rising interest rates as primary reasons why they feel that way. Notably, 40% of producers who feel it’s a bad time to invest cited rising interest rates as a key reason, up from 35% last month and up from 14% when this question was first posed in July 2022. Starting in July 2023, the survey has posed an additional question to producers who say it’s a good time to invest. Among those who think the investment climate is favorable, the number one reason cited the last three months has been strong cash flows on their farm operations.
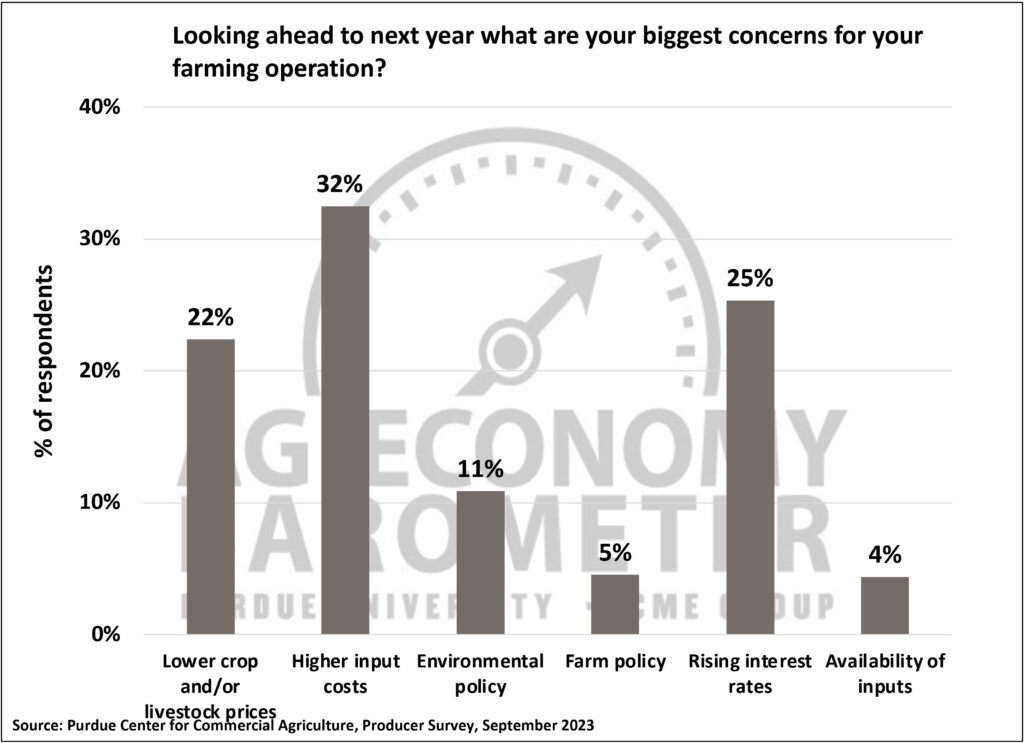
Producers continue to point to high input costs as a top concern for their farming operations in the year ahead, with nearly one-third of respondents in this month’s survey saying that it’s their number one concern. Nearly tied for second place this month were rising interest rates, chosen by 25% of respondents, and lower crop and/or livestock prices, chosen by 22% of farmers in this month’s survey. The percentage of producers choosing lower crop and/or livestock prices has increased since the beginning of the year when just 16% of producers cited it as a top concern.
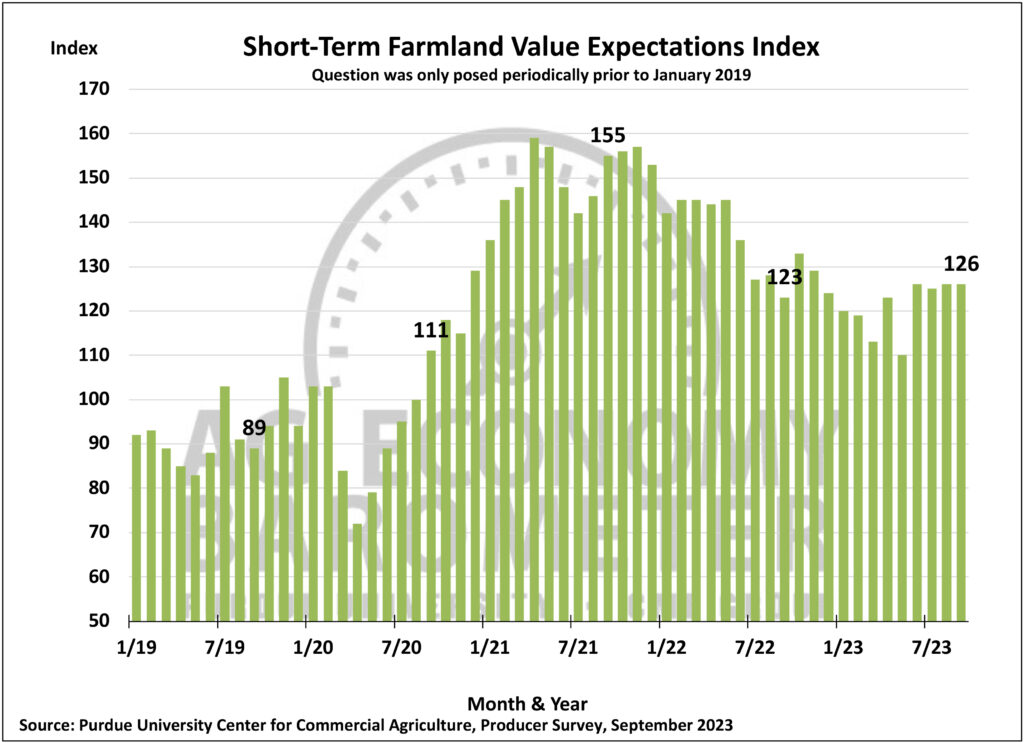
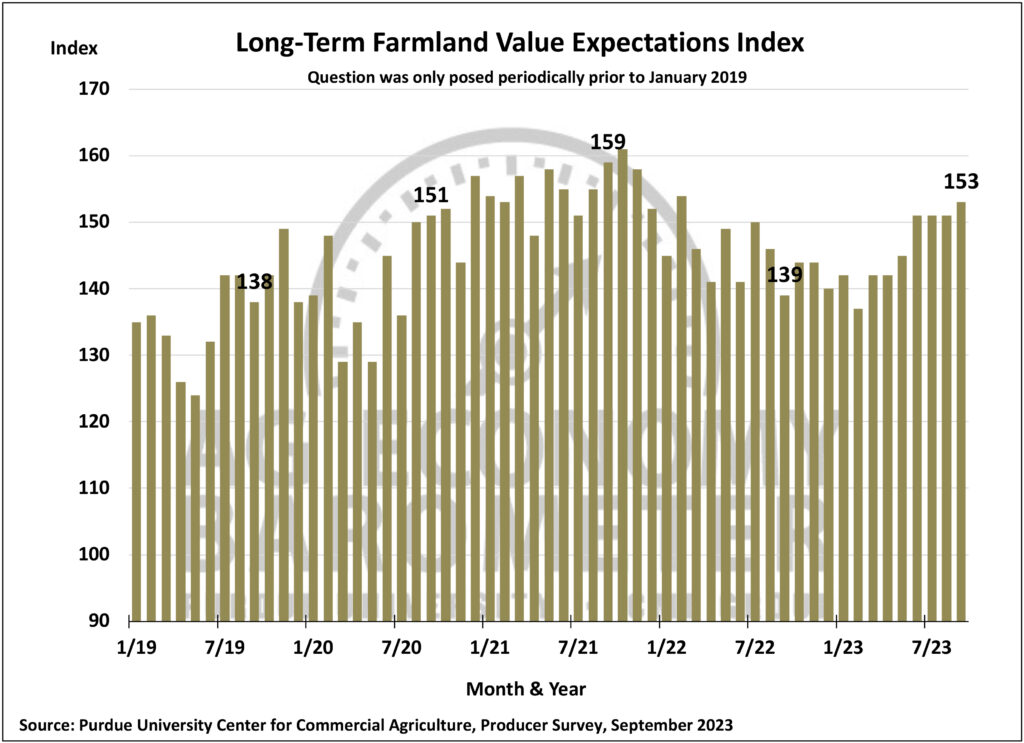
Producers remain relatively optimistic about farmland values. The Short-Term Farmland Value Expectations Index was unchanged at a reading of 126 while the long-term index rose 2 points to 153. The long-term index, which is focused on the five-year outlook, has climbed 16 points since hitting its low point back in February. The short-term index bottomed in May at a reading of 110 before bouncing back to its current level in June. The relative optimism about farmland values expressed by producers is somewhat surprising given concerns expressed about high input costs, rising interest rates, and the risk of lower crop and or livestock prices. Respondents who expect farmland values to rise over the next five years continue to point to non-farm investor demand for farmland along with inflation as the top two reasons for farmland values to continue rising.
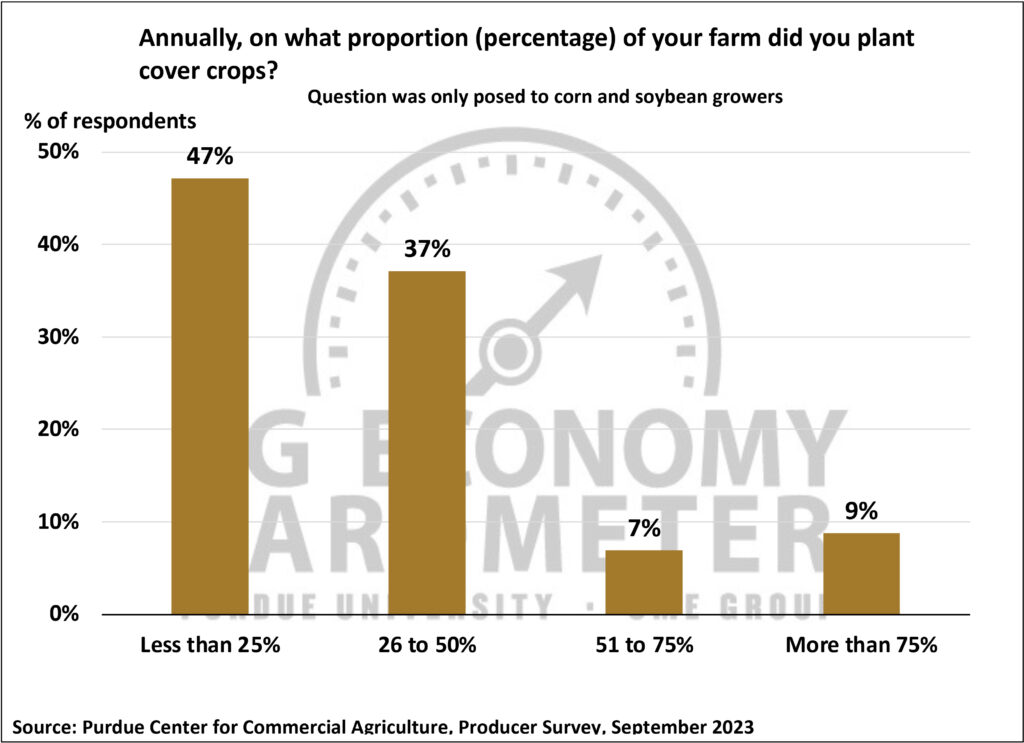
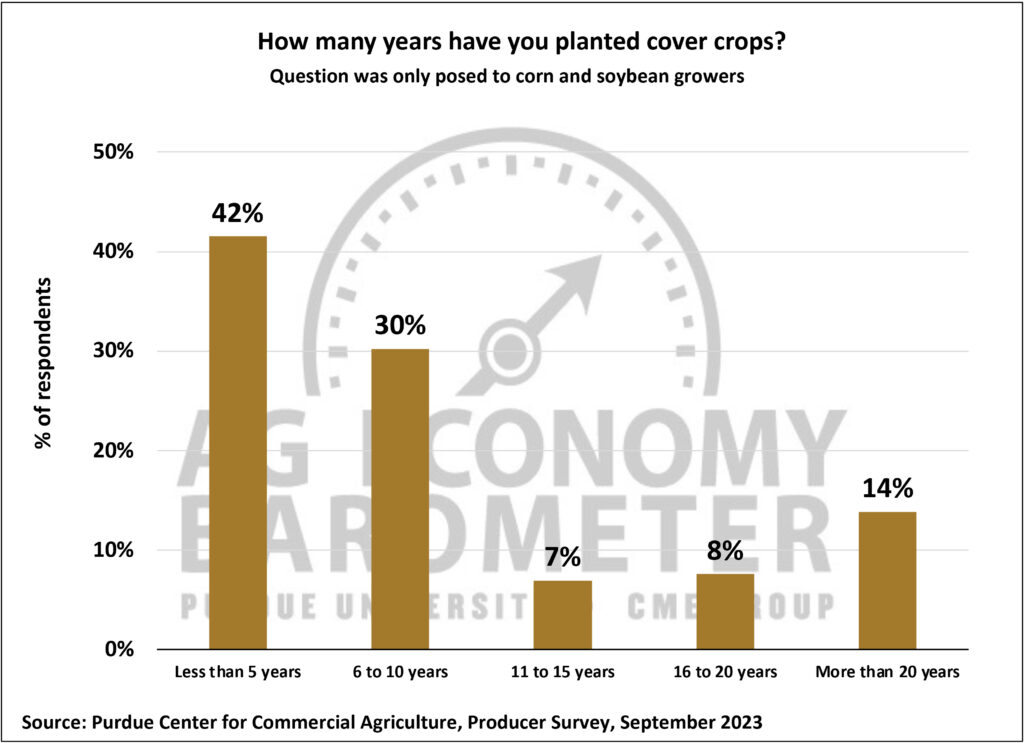
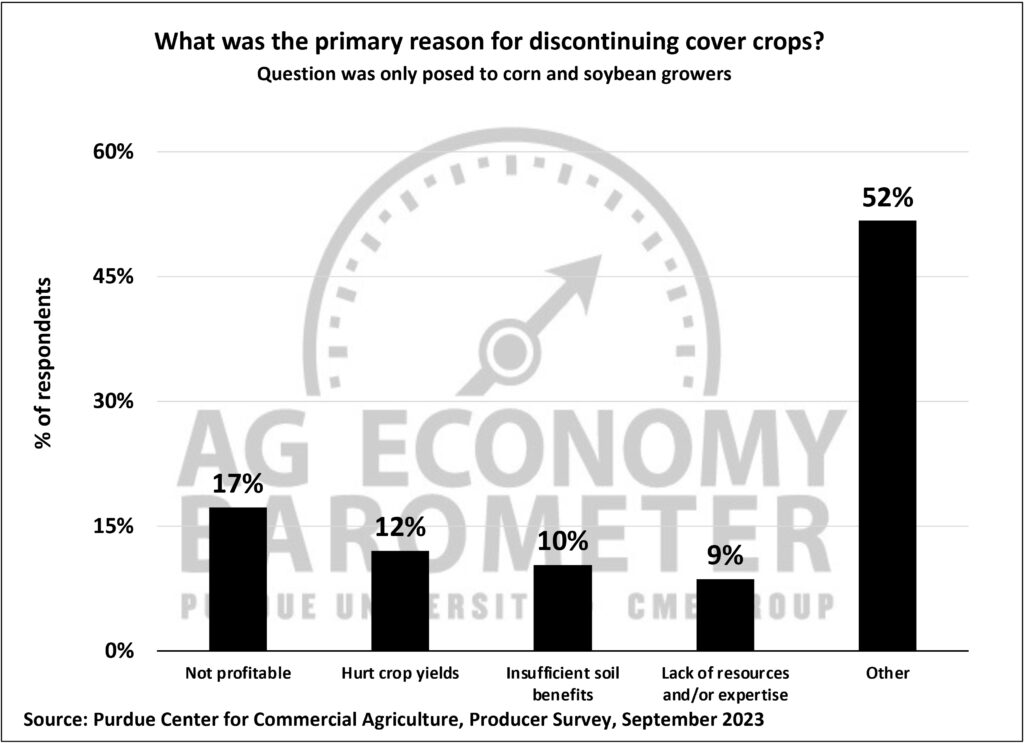
The September survey included several questions posed to corn and soybean growers to learn more about their perspective on cover crops. Just over half (52%) of the corn/soybean growers said they currently plant cover crops on a portion of their acreage. However, of this group, nearly half (47%) of them said they used cover crops on no more than 25% of their acreage. Among those who reported having used cover crops, 41% of respondents said they had used cover crops for 5 years or less, while 14% said they’ve been using cover crops for more than 20 years. The top two reasons cited by cover crop users for planting cover crops were improves soil health and improves erosion control. Farmers who tried planting cover crops and chose to discontinue their use pointed to varied reasons for dropping cover crops from their rotation, including saying it was not profitable, followed by hurts crop yields, insufficient soil benefits, and a lack of resources to plant cover crops. Interestingly, just over half of producers who discontinued planting cover crops said there were “other” reasons for not planting cover crops in addition to those provided in the response list.
Wrapping Up
Farmer sentiment weakened in September as the Ag Economy Barometer fell 9 points from its August reading. The dip in farmer sentiment was attributable to producers’ concerns about both the current situation and the future as both the Current Conditions and Future Expectations indices declined. Worries about the risk of declining prices for crops and livestock along with ongoing concerns about high input costs and interest rates weighed on producer sentiment this month. Despite the weak sentiment reading, producers remain relatively optimistic about farmland values as expressed by both the short and long-term farmland values indices.