


To view the latest Oklahoma drought map, CLICK HERE.
According to the latest Oklahoma drought monitor report, exceptional drought remains at zero, unchanged from the past three months.
Extreme drought or worse is at 1.16 percent, unchanged from last week’s percentage.
Severe drought or worse is now at 11.38 percent, slightly improved from last week’s 13.68 percent.
Moderate drought or worse is at 33.39 percent, slightly improved from last week’s 36.34 percent.
Abnormally dry or worse conditions are now at 51.95 percent, improved from last week’s 55.32 percent.
According to the 6-to-10-day precipitation outlook map, the entire state of Oklahoma is leaning below a 40 to 50 percent chance of precipitation through December 9.
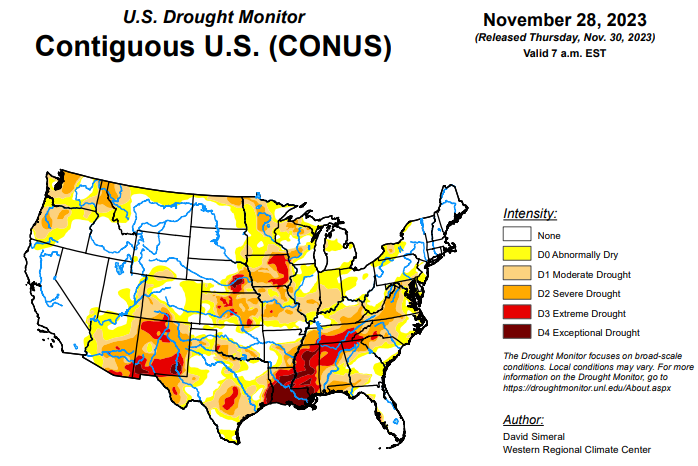
To view the United States Drought Map, click here.
According to the latest U.S. Drought Monitor, this week saw some minor expansion of drought across areas of the West (Colorado, Idaho, Montana, Wyoming) and Midwest (Illinois, Indiana, Missouri), while conditions improved on the map in drought-affected areas of the South (Mississippi, Oklahoma, Tennessee, Texas), Southeast (Alabama, Carolinas, Florida, Virginia), Northeast (Delaware, New Jersey, Pennsylvania), High Plains (Kansas), and the West (Montana, New Mexico). For the week, cooler-than-normal temperatures prevailed across most of the conterminous U.S. with the largest departures observed across areas of the Intermountain West, central and southern Plains, and Texas where temperatures were 6 to 10 degrees below normal. In terms of precipitation, light to heavy snowfall accumulations (2 to 36 inches) were observed across areas of the central and southern Plains, Upper Midwest, and the Northeast with the heaviest accumulations falling in the Northeast. In areas of the South, Southeast, and Mid-Atlantic, light to heavy precipitation accumulations (1 to 4 inches) were observed leading to targeted improvements in drought-affected areas on the map. Out West, moderate to heavy snowfall accumulations were observed in the mountain ranges of central Utah and western Colorado as well as in northern portions of Arizona and New Mexico. The heaviest accumulations (up to 36 inches) were observed in the San Juan Mountains of southwestern Colorado. Overall, early-season snowpack conditions across the West have been below normal apart from some drainage basins (6-digit HUCs) in the Great Basin, Lower Colorado, and Rio Grande basins. According to the Natural Resources Conservation Service (NRCS) SNOTEL network (11/28), region-wide (2-digit HUCs) percent of median snow water equivalent (SWE) levels were as follows: Pacific Northwest 53%, Missouri 62%, California 39%, Great Basin 62%, Upper Colorado 59%, Lower Colorado 100%, Rio Grande 53%, and Arkansas-White-Red 55%. In the Hawaiian Islands, locally heavy showers and thunderstorms associated with an ongoing Kona Low system are bringing much-needed moisture to drought-affected areas of the island chain this week.
In the Southern Plains, precipitation during the past 14-day period led to improvements on the map in isolated areas of Mississippi, Tennessee, Oklahoma, and Texas. However, significant precipitation deficits remain across areas of the region including along the Gulf Coast regions of Texas, Louisiana, and Mississippi where 6-month shortfalls range from 8 to 20+ inches. According to the latest U.S Department of Agriculture (USDA) Weekly Weather and Crop Progress Bulletin (11/26), the percentage of topsoil in Louisiana rated short to very short was 72%, while neighboring Mississippi was rated 66% short to very short. In Texas, statewide reservoir conditions were at 68% full (11/29), according to Water Data for Texas. Moreover, the best reservoir conditions (% full) were observed in the East Texas (86.6%), North Central (84.1%), and Upper Coast (84.9%) climate regions while the poorest conditions were reported in the South (21%), Edwards Plateau (31.1%), and High Plains (36.9%) regions. Looking at streamflow conditions in Louisiana and Mississippi, the U.S. Geological Survey (USGS) is reporting numerous streams and rivers with flows below the 10th percentile (11/29). In terms of drought-related impacts during the past 30 days, there has been a significant decline in the number of impact reports coming into the NDMC CMOR system.
In the High Plains, this week’s map, some minor improvements were made in areas of Kansas in response to improving conditions during the past 30-60 days, including beneficial snowfall observed over the Thanksgiving holiday weekend. Elsewhere, degradations were made in areas of eastern Colorado where drier-than-normal conditions have prevailed during the past 30-60-day period. In the Dakotas, conditions on the map remained status quo. In terms of snowpack conditions, the NWS NOHRSC reports the Upper Midwest Region (which includes the Dakotas and eastern portions of Montana) is currently 3.1% covered by snow as compared to 66.3% last month. Average temperatures for the week were below normal (2 to 8 degrees F) with the greatest departures observed in the plains of Colorado and Wyoming as well as in Kansas.
In the West, on the map, improvements were made across areas of the Southwest and Pacific Northwest including New Mexico, Oregon, and Montana. In northern New Mexico, areas of Extreme Drought (D3) were reduced in response to recent precipitation (past 14-day period) including high-elevation snowfall in the Nacimiento and Sangre de Cristo ranges. In Montana, a mix of improvements and degradations were made on this week’s map, including the removal of an area of Moderate Drought (D1) in north-central Montana where conditions have improved across various metrics during the past 60-day period. In northeastern Oregon, areas of Moderate Drought (D1) were trimmed back around the Blue Mountains where Water-Year-to-Date precipitation (10/1) has been above normal. In south-central Colorado, areas of Severe (D2) and Extreme (D3) drought expanded slightly in areas where month-to-date precipitation has been well below normal. Overall, the West has gotten off to a slow start in terms of snowpack conditions across the region except for some basins in the southern tier of the region. In California, the California Cooperative Snow Surveys reports statewide snowpack conditions at 30% of normal for the date (11/29). For the week, average temperatures were below normal across most of the region with areas of the Intermountain West experiencing departures ranging from 4 to 10 degrees F below normal.
Looking ahead, the NWS Weather Prediction Center (WPC) 7-Day Quantitative Precipitation Forecast (QPF) calls for moderate-to-heavy precipitation accumulations (including heavy snowfall) ranging from 3 to 10+ inches (liquid) across the Olympic Mountains, Cascades of Oregon and Washington, Klamath Mountains, and Coast Ranges of northwestern California. Further inland, lesser accumulations (1 to 3 inches liquid) are expected in areas of the Northern Rockies, northern Great Basin, and ranges of the Intermountain West. In the South and Southeast, moderate to heavy rainfall accumulations (2 to 5 inches) are forecasted while light accumulations (generally <1 inch) are expected in eastern portions of the southern Plains, Lower Midwest, Mid-Atlantic, and the Northeast. The NWS Climate Prediction Center (CPC) 6-10 Day Outlooks call for a moderate-to-high probability of above-normal temperatures across the western two-thirds of the conterminous U.S. in an area extending from the Midwest to the West Coast, while near-normal temperatures are expected across most of the eastern tier. Conversely, below-normal temperatures are expected across Florida. In terms of precipitation, below-normal precipitation is expected across much of the southern tier of the conterminous U.S. as well as the central and southern Plains, lower Great Basin, and the central and southern Rockies. Meanwhile, above-normal precipitation is forecasted for the Pacific Northwest, northern California, northern Great Basin, northern Rockies, Mid-Atlantic, and the Northeast.
To view the 6-10 Day Precipitation Outlook Map, click here.
To view the 6-10 Day Temperature Outlook Map, click here.
To view the Monthly Drought Outlook Map, click here.


