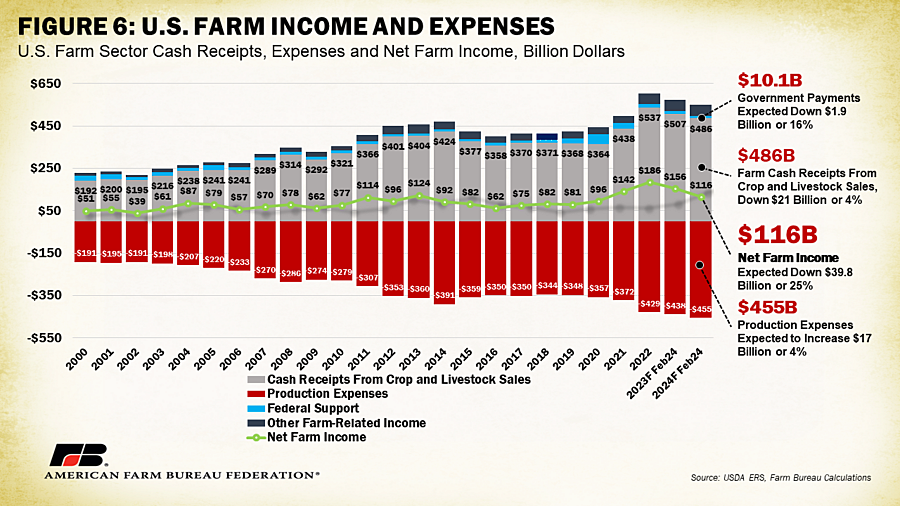
On Feb. 7, USDA released the first insights into net farm income expectations for 2024. The latest report anticipates a decrease from 2023’s forecast of $155 billion to $116 billion – a drop of nearly $40 billion, or 25.5%, and the largest recorded year-to-year dollar decrease in net farm income. The decline marks the second consecutive drop since record-high farm income levels in 2022 ($185.5 billion). When adjusted for inflation, net farm income, a broad measure of farm profitability, is expected to decrease 27%, or $43 billion, from 2023. If realized, 2024 net farm income would be below the 20-year average (2003-2022) in inflation-adjusted dollars. A $21 billion expected drop in cash receipts for agricultural goods and a $17 billion expected increase in production expenses explain 95% of the forecast decline.
The forecast for 2023 net farm income in this report was also updated from December’s report, increasing marginally from $151 billion to $156 billion. Net farm income reflects income after expenses from production in the current year and is calculated by subtracting farm expenses from gross farm income. A year-to-year drop of this magnitude parallels a recent decline in general farmer sentiment as lower expectations set in for commodity prices in 2024. Importantly, this is still a very early measure of farm financial health. Countless factors will shape supply and demand conditions over the course of the next 11 months.
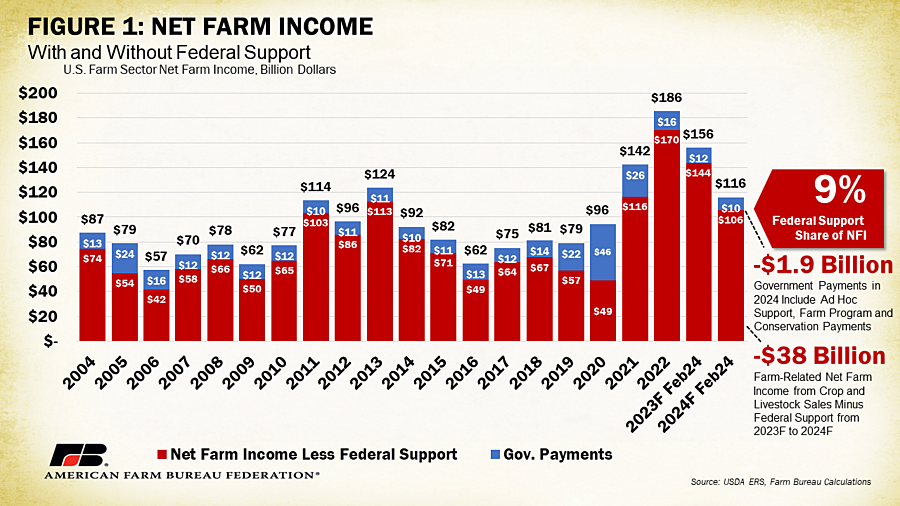
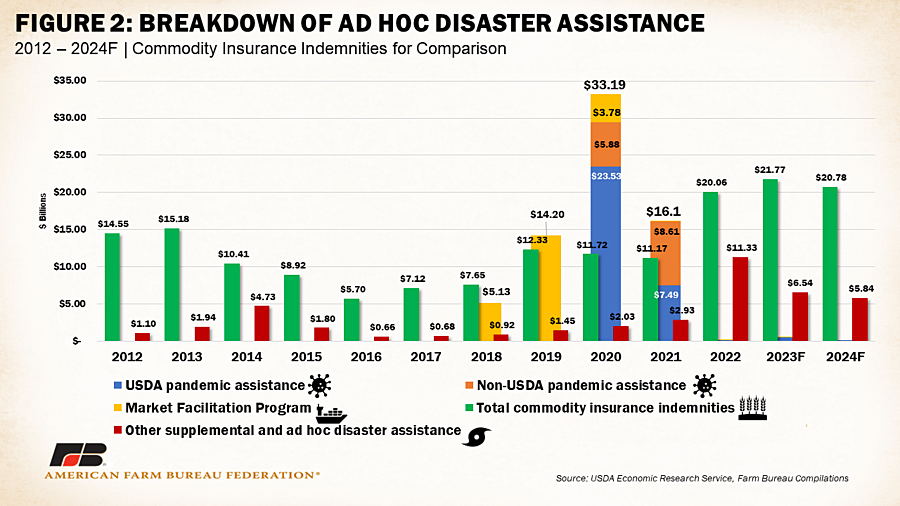
Direct government payments are estimated to decrease by $1.9 billion, or 16%, between 2023 and 2024 to slightly over $10 billion and about 9% of net farm income. This marks the fourth consecutive annual decrease in government payments for producers since the peak of the COVID-19 pandemic in 2020 and would represent the lowest value since 2014, even without adjusting for inflation. Ad hoc and supplemental program payments, which include payments from the Emergency Relief Program (ERP), Quality Loss Adjustment Program and other farm bill designated-disaster programs, are expected to decrease from $6.54 billion to $5.84 billion, an 11% decline and $5.49 billion less than paid out during 2024. The previous announcement of limited additional funds to extend ERP to cover 2022 disaster losseshave reduced expected payments in this category, which is reflected in the lower values. Pandemic era programs that contributed to as much as 48% of net farm income in 2020 no longer contribute to farmers’ cash flow.
Commodity insurance indemnities, included for comparison to ad hoc disaster programs, are forecast down slightly in 2024, moving from $21.77 billion to $20.78 billion but remaining well above the prior 10-year average of $12.72 billion. The number of crop insurance programs has increased and along with it the total value of liabilities across sold crop insurance policies. Increased participation and difficult weather have resulted in higher-than-average indemnity payments the past several years. Additionally, ERP still requires those who receive payments to enroll in crop insurance or Noninsured Crop Disaster Assistance Program coverage (when crop insurance is not available) for the next two available crop years. This pushes up crop insurance participation further, contributing to additional indemnities as more farmers are encouraged to manage their risks.
Crops
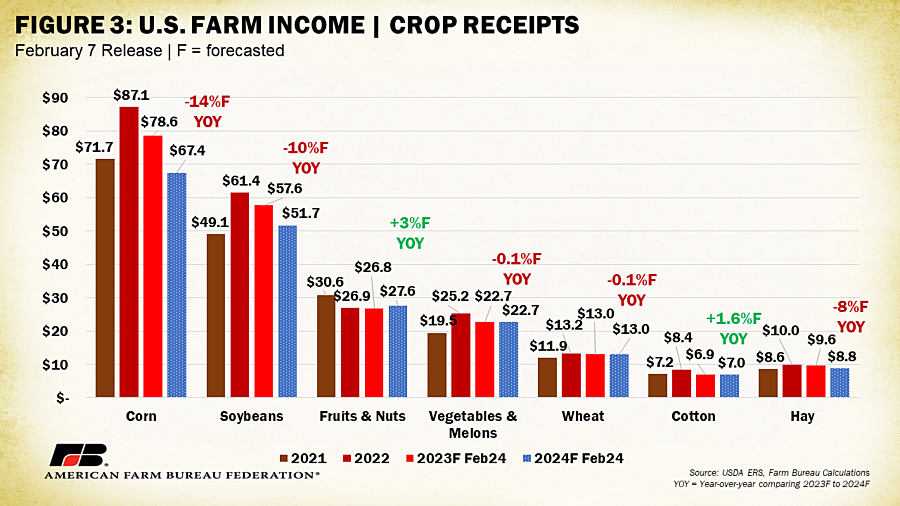
Cash receipts for crop and livestock sales are expected to move from $507 billion in 2023 to $486 billion in 2024 for a loss of $21 billion (4%). The forecast decline in crop receipts explains nearly 80% of this difference, signaling a weaker incoming year for row crop prices. Receipts for all crops are forecast to drop to $16.7 billion (6%). Corn receipts are forecast down $11.3 billion (14%) and are responsible for much of the expected crop receipts decline. Corn futures prices have recently dropped to a three-year low on expectations of high global supplies. Soybean receipts are expected down $6 billion (10%), hay receipts down $800 million (8.3%) and wheat and vegetable and melon receipts .5% or less. Cash receipts for fruits and tree nuts and cotton buck the trend of crop-related income declines. Fruit and tree nut receipts are expected to increase $800 million (2.8%) and cotton receipts are forecast to increase by $100 million (1.6%). Heavily traded grain commodities face strong supply dynamics that have weakened price outlooks for the year, substantially contributing to the $16.7 billion expected difference between 2023 and 2024.
Livestock
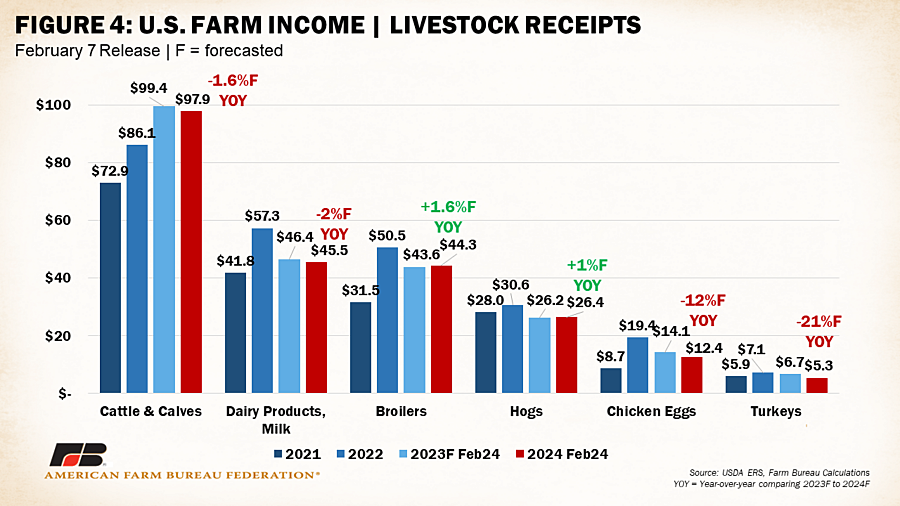
Cash receipts for livestock are also forecast down between 2023 and 2024, though not to the same magnitude as crops. Total animal product receipts are expected to decrease $4.6 billion (1.9%) from $244 billion to $239 billion. After several years of gains, receipts for cattle and calves are expected down $1.6 billion (1.6%) – the largest drop among the livestock categories. With the smallest cattle inventories in the U.S. in 73 years, prices for beef will likely be strong but largely offset by limited production. Turkey producers are expected to face a rough year, according to these numbers. Cash receipts for turkeys are expected down $1.4 billion (21%). Growing flocks less impacted by avian influenza and weaker-than-expected consumer demand may explain this grim outlook. Similarly, cash receipts for chicken eggs are expected down $1.7 billion (12%) for likely similar reasons. Receipts for dairy products and milk are expected down $900 million (2%) primarily linked to lower expected prices. Growing inventories of cold stored cheeses and larger supplies globally create downward pressures against strengthening Class prices. Broilers and hogs are the only categories expected to see increases, up $700 million and $300 million respectively. Though any positive number is welcome, hog producers faced record losses in 2023 that will not be substantially offset by a $300 million across industry gain. Strong demand from consumers for chicken meat continues to boost prices in the broiler arena. For most livestock categories, the forecast difference in cash receipts between 2023 and 2024 is quite small especially as compared to the difference from 2022. This suggests that many livestock producers can expect similar pricing dynamics to 2023 for 2024 (aside from turkey and egg producers).
Production Expenses
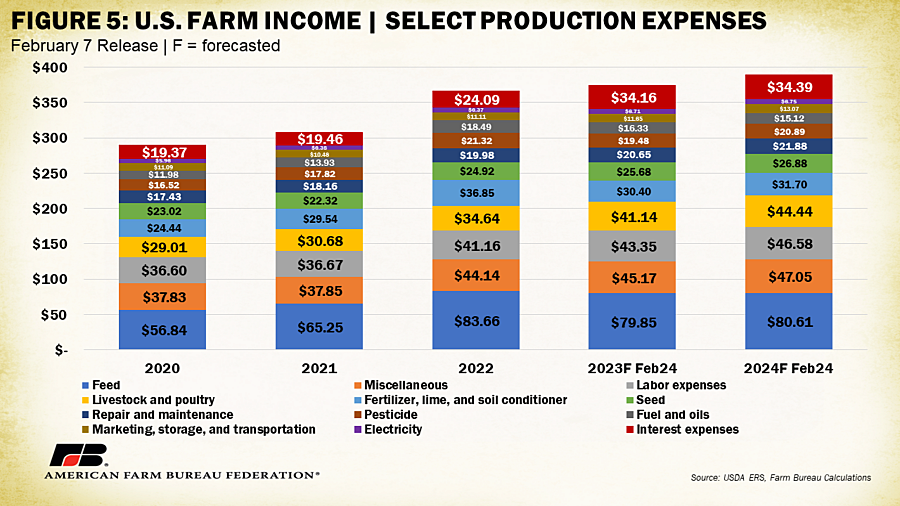
Behind a drop in cash receipts, the most significant contributor to an expected farm income drop is attributable to higher production expenses, estimated to increase 4%, or $16.7 billion, over 2023 for a total of $455 billion across the farm economy. This marks the sixth consecutive year of production expense increases and fourth consecutive year production expenses hit a new record high. Production expenses are expected up across almost all categories.
These rising production expenses have left many farmers exposed in 2023 and beyond to the limitations of farm programs that are focused on fixed reference prices, or slowly adjusting price and revenue histories, which are among the issues up for discussion in the current farm bill debate.
The largest percent increases between 2023 and 2024 are expected between marketing, storage and transportation (up 12%), the cost of labor (up 7.5%) and the cost of pesticides (up 7.2%). After a year of declines for fertilizer, USDA expects a 4.3% increase between 2023 and 2024 (from $30.4 billion to $31.7 billion) though still quite a bit lower from the $36.8 billion spent in 2022. Even with improving inflationary conditions, interest expenses are expected up $230 million (about 1%), meaning relief around the cost of capital and servicing that capital is not expected for much of 2024. The Federal Reserve has held the federal funds effective rate at 5.33% since August 2023 with indications that lower rates could be many months away. This dynamic is reflected in USDA’s estimations that interest expenses will increase for farmers and ranchers. The only main expense category forecast to decrease is fuels and oils, expected to drop over 7% ($1.21 billion) across the farm economy as fuel prices continue to recede from record levels in 2022. Farmers and ranchers will see no relief on the expense side of their balance sheet, according to these early numbers.
Other farm income, which includes things like income from custom work, machine hire, commodity insurance indemnities and rent received by operator landlords, is estimated to decrease by $100 million, from $54.1 billion in 2023 to $54 billion in 2023. When all factors influencing income are accounted for, the resulting expectations for a sharp net farm income decline become apparent, as illustrated in Figure 6.
Summary
USDA’s most recent estimates for 2024 net farm income provide a very early forecast of the farm financial picture. For 2024, USDA anticipates a decrease in net farm income, moving from $155 billion in 2023 to $116 billion in 2024, a decrease of 25.5%. Much of the forecasted decline in 2024 net farm income is tied to lower crop and livestock cash receipts and continued increases in production costs. It is important to highlight the early nature of this forecast. For example, net farm income numbers for 2023 will not be finalized until August 2024 and have already been adjusted by over $18 billion since the first estimates were released in February 2022. USDA digests new information and data as it becomes available, shifting calculations from estimates to actual values. This means there is still much uncertainty in final 2024 net farm income. Numerous supply and demand conditions must unfold before economists can have confident expectations for the year’s farm income.
With an early expectation of significant revenue declines, though, it becomes all the more important for producers to have clarity on rules that impact their businesses’ ability to operate and for producers to have access to comprehensive risk management options. Farmers and ranchers will have a resounding voice, as they should, in the formulation of vital legislation such as the farm bill, which can either complicate or streamline their ability to contribute to a reliable and resilient U.S. food supply.


