

To view the latest Oklahoma drought map, CLICK HERE.
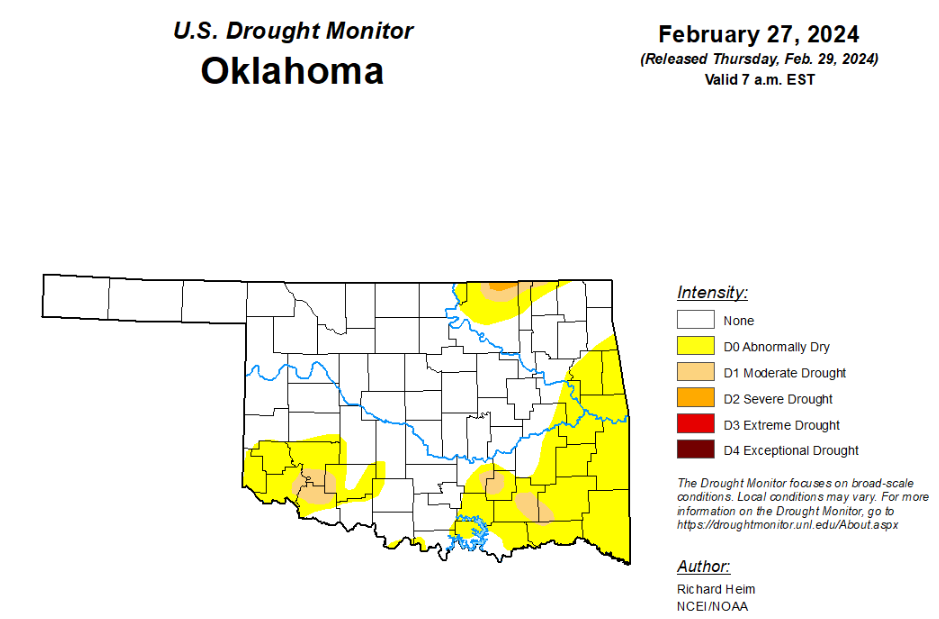
According to the latest Oklahoma drought monitor report, exceptional drought remains at zero percent, unchanged from the start of the calendar year.
Extreme drought or worse remains at zero percent, unchanged from the past nine weeks.
Severe drought or worse is unchanged from the past two weeks at .19 percent.
Moderate drought or worse is unchanged from the past two weeks at 3.23 percent.
Abnormally dry or worse conditions have increased from last week’s 16.61 percent to 30.80 percent.
According to the 6-to-10-day precipitation outlook map, the Panhandle is likely above a 50 to 60 percent chance of precipitation through March 9, and the rest of the state is leaning above a 40 to 50 percent chance of precipitation through that date.
To view the United States Drought Map, click here.
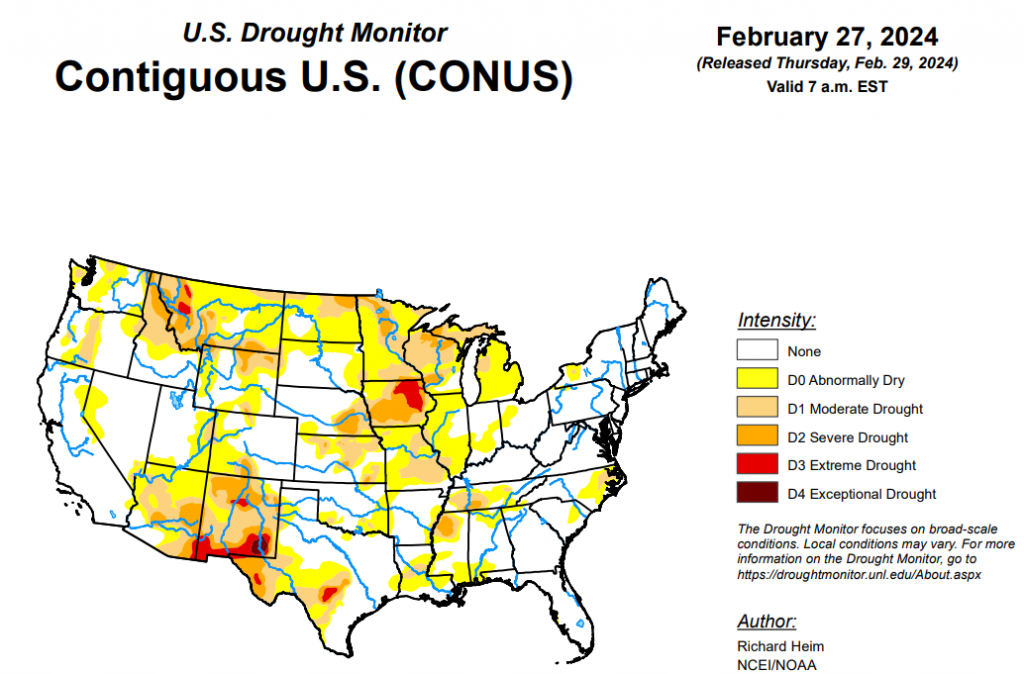
According to the latest U.S. Drought Monitor Report, several weather systems moved across the contiguous U.S. (CONUS) during this U.S. Drought Monitor (USDM) week (February 21-27). Their fronts and surface lows spread rain and snow across parts of the West at the beginning and end of the week, and over the Tennessee to Ohio Valleys and Appalachians at mid-week. These systems were associated with an upper-level circulation pattern that consisted of low-pressure troughs just off the west coast and east coast, with a high-pressure ridge over the central part of the country. The ridge brought above-normal temperatures to much of the CONUS, from the Rocky Mountains to Appalachian Mountains, with weekly temperatures averaging 15-20 degrees F above normal from Texas to the northern Plains and Upper Mississippi Valley. Temperatures averaged near to cooler than normal in parts of the interior West to Pacific Coast and along the Eastern Seaboard. The ridge also inhibited precipitation from the Rockies to Mississippi Valley. The precipitation in the West was mainly over mountain ranges but was not enough to improve drought conditions. The precipitation in the Midwest was enough to prevent further drought expansion or intensification where it was wetter than normal for the week. In other areas, drought or abnormal dryness expanded or intensified in parts of the Plains and Midwest, and a few parts of the Pacific Northwest, Gulf of Mexico coast, and Mid-Atlantic coast.
In the Southern Plains, northern parts of Tennessee received 0.5-1.5 inches of precipitation this week, but most of the South region was dry with no precipitation occurring. Much warmer-than-normal temperatures accompanied the dryness, with daytime maximum temperatures in excess of 90 degrees F recorded in Texas. Dallas/Fort Worth reached 94 on February 26, which was a daily record and 31 degrees above normal. The hot temperatures increased evapotranspiration which drew moisture out of the soils. The recent dry weather, accompanied by low relative humidity and windy conditions, contributed to an outbreak of wildfires across parts of the region. D0 expanded in southwest Texas where air temperatures were hot, soils were hot and dry, and the last 3 months were drier than normal. Dry 1- to 3-month SPI values prompted expansion of D0 in eastern Oklahoma and adjacent parts of northeast Texas and western Arkansas. Dead fields in Sebastian County, Arkansas, were reported via the CMOR (Condition Monitoring Observer Reports) reporting system. D0 expanded in southern Mississippi, adjacent parts of Louisiana, and southeast Texas where SPI was dry, streamflow was low, and some soil moisture indicators showed dryness, and D0 expanded in southeast Tennessee where 1- to 2-month SPEI (Standardized Precipitation Evapotranspiration Index) showed dry conditions. A reassessment of data resulted in the deletion of the relic D0 along the southeast Louisiana coast.
In the High Plains, were a few areas of half an inch to locally 2 inches of precipitation in the High Plains region this week – in North Dakota and parts of Colorado and Wyoming. But the rest of the region had little to no precipitation. Daily high temperatures reached into the 80s F some days in Kansas and up to the 50s and 60s in the Dakotas. Weekly temperatures averaged 10 to 20 degrees above normal across most of the region, increasing evapotranspiration (ET). Since this is February and vegetation is still dormant, the above-normal ET had little effect on vegetation, but soil temperatures were well above freezing in southern parts of the region and the high ET helped to dry soils. D0 expanded in the Dakotas, and D1 crept into northwest North Dakota, to reflect the 1- to 2-month dryness and unusually warm temperatures, and D0 expanded in eastern Kansas where recent precipitation has been low and soils were drying. In Wyoming, very low mountain SWE (snow water content) and dry 1- to 4-month SPI values prompted the expansion of D0-D2.
In the West, two to locally 5 inches of precipitation fell in the Oregon and Washington Cascade and Coastal mountains this week, with half an inch to locally 2 inches in the northern and central Rockies and southern California, and 0.5 to 1.5 inches in the Sierra Nevada and parts of coastal California. Outside of these areas, precipitation was generally less than a fourth of an inch, with rainshadow areas and the Southwest (Four Corners States) mostly dry. The precipitation was above normal for the week in some areas, particularly parts of the Cascades, Rockies, and southern California. But amounts were not enough to bring month-to-date totals to near normal values, with these areas still well below normal for the month. And snowpack improved little, with just a few inches of new snow added to most Cascade and Coastal mountain SNOTEL sites. Mountain snowpack and SWE values were still well below normal to near-record low in Washington, Oregon, Idaho, and Montana. In California, as of February 27, mountain SWE was 94% of normal in the northern Sierra Nevada Mountains, 78% of normal in the Central Sierra, and 76% of normal in the southern Sierra. In Washington, D0-D1 was expanded in the northern Cascades and D1 added to the Olympic Mountains to reflect the low snowpack and subnormal precipitation. Low SWE and 1- to 4-month SPEI values resulted in expansion of D0-D3 in parts of Montana.
Looking ahead, in the two days since the Tuesday valid time of this USDM, Pacific moisture continued to move across the Coastal and Cascade ranges in the Pacific Northwest, with precipitation falling in areas east of the Mississippi River and in parts of the southern Plains. For February 29-March 5, a ridge over the eastern CONUS will bring warmer-than-normal temperatures to much of the country east of the Rockies while a trough contributes to cooler-than-normal temperatures in the West. Forecast models predict a wet period for much of the West, in the Upper Rio Grande Valley, and from the Lower Mississippi Valley to the East Coast, as low-pressure systems and fronts bring locally heavy precipitation. The Coastal, Cascade, and Sierra Nevada mountain ranges could see 5 to 10 inches of precipitation, or locally more, while the central to northern Rockies could receive 2 to 4 inches of precipitation. Parts of southern New Mexico and western Texas could receive up to an inch of rain. An inch or more of precipitation is predicted from southern Louisiana to southern New England. Outside of these wet areas, up to half an inch of moisture could fall in the lower elevations of the West, across the northern and southern Plains, and Midwest to Northeast. Areas that could miss out on the precipitation stretch from southern California to the central Plains, where little to no precipitation is expected, and the southern Plains and Mid-Mississippi Valley to eastern Great Lakes, where less than a fourth of an inch may fall.
For much of the next 2 weeks, the atmospheric circulation is expected to continue an upper-level trough over the western CONUS and a ridge over the eastern two-thirds of the country, with Pacific weather systems migrating through the trough/ridge pattern. The Climate Prediction Center’s (CPC) 6-10 Day Outlook (valid March 4-8) and 8-14 Day Outlook (valid March 6-12) favor a fairly stable pattern of warmer-than-normal temperatures from the Plains to East Coast and cooler-than-normal temperatures over the West and Alaska. The outlook is for above-normal precipitation over eastern and southern Alaska and much of the CONUS, especially east of the Mississippi River, with odds favoring near to below-normal precipitation over the northern Rockies to northern Plains and over the west coast of Alaska.
To view the 6-10 Day Precipitation Outlook Map, click here.
To view the 6-10 Day Temperature Outlook Map, click here.
To view the Monthly Drought Outlook Map, click here.


