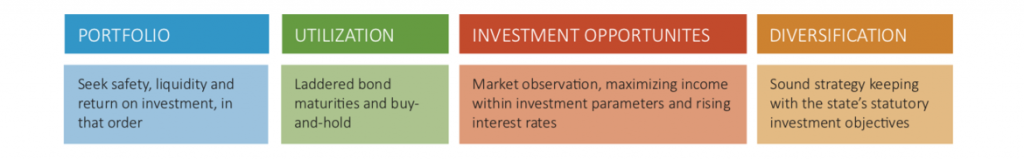
PORTFOLIO PERFORMANCE, DIVERSIFICATION, AND STRATEGY
February portfolio yielded 3.13%, up from 2.11% last year, with a weighted average maturity of 989 days.
Total assets under management of $15.9 billion, up $1.6 billion in comparison to February 2023.
Total portfolio contained 68% in U.S. Treasurys, 7% in U.S. government agencies,
16% in mortgage-backed securities, 8% money market mutual funds, 0.3% in certificates of deposit,and 0.6% in state bond issues and foreign bonds, comprising the balance of funds invested
“Total portfolio yields are lower than current yields due the laddered structure of the investments over a 3 year average. Yields will continue to grow as the portfolio sheds the older investments and takes on the influence of the new rate range.” STATE TREASURER
TOTAL FUNDS INVESTED Funds available for investment at market value include the State Treasurer’s investments at $12,271,507,318 and State Agency balances in OK Invest at $3,589,328,644 for a total of $15,860,835,962.
MARKET CONDITIONS
February ended with gains across the board for US Treasury rates. The 10-year treasury closed out February up 0.34% to 4.25%. The 2-year treasury jumped 0.41% to 4.62%. The 30-year treasury rose 0.21% over the month to a rate of 4.38%.
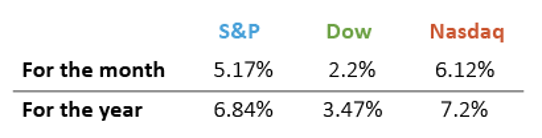
February continued the theme of record-setting growth seen lately in the stock market. The market took a bit of a hit on Feb. 13, due to the consumer price index (CPI) coming in hotter than expected. However, the Fed’s preferred measure of inflation, the PCE (personal consumptions expenditures) index met expectations, boosting the market upon its Feb. 29 release. The Nasdaq reached its highest close since November 2021, up 6.12% for the month. The S&P finished the month up 5.17% and the Dow 2.22%, marking one of the strongest Februarys in recent history, with Forbes reporting “The S&P and Nasdaq each notched their best February returns since 2015, while the Dow had its best February since 2021.”
Since the Federal Reserve’s meeting on Jan. 31, we’ve seen no signs of optimism regarding May rate cuts. The federal funds rate is currently at 5.25%-5.5%, where it has sat since July 2023. With the CPI increasing 3.1% year-on-year as of January, May rate cuts are not very likely. An annualized CPI increase of 2.9% was projected for January. Breaking the 3% mark would be a strong sign inflation is cooling and heading toward the Fed’s 2% target. The Wall Street Journal says “Interest-rate futures, which before Tuesday’s report implied the central bank would probably begin cutting rates by its May meeting, now suggest a June start date is more likely.”
ECONOMIC DEVELOPMENTS
The unemployment rate for February increased to 3.9%, up from 3.7% in January. Total nonfarm payroll increased by 275,000, compared to January’s downwardly revised increase of 229,000.
The CPI increased 0.4% in February. This is compared to January’s 0.3% increase. Over the last 12 months, the index has risen 3.2%. This figure is higher than January’s 3.1% year-over-year increase, and economists’ expectations of 3.1%. Shelter once again rose, coming in at a 0.4% increase for the month. Energy is up 2.3%, after January’s 0.9% decrease. The Associated Press says “Despite February’s elevated figures, most economists expect inflation to continue slowly declining this year. At the same time, the uptick last month may underscore the Fed’s cautious approach toward interest rate cuts.” Core CPI, which excludes energy and food prices, increased 0.4% in February, the same as January’s increase. The producer price index (PPI) increased by a seasonally adjusted 0.6% for the month of February, well above the Dow Jones estimate of 0.3%. “On the services side the increase was 0.3%,” says United Press International News.
Retail sales fell by 0.8% in January, ending the theme of growth that was seen from a downwardly revised 0.4% increase in December. According to the Associated Press, “Excluding sales at auto dealerships and gas stations, sales were down 0.5% for the month. The decline was bigger than the 0.1% drop that economists projected and marked the lowest monthly figure since March of last year.” The sales control group, which excludes autos and gas, building materials, and food service, dropped by 0.4%. The weak report can partly be attributed to poor weather conditions and the end of holiday shopping.
February saw the number of homes actively for sale grow by 14.8% compared to the same time last year. January’s year-over-year increase was 7.9%. While inventory increased the last 4 months, it’s still down 39.6% compared to 2017–2019. Growth in the $200,000-$350,000 range increased faster than all other price categories, rising 20.6% compared to last year. According to Realtor.com, “Home shoppers will have more choice than in recent years heading into the spring homebuying season, and in particular more choice of lower-priced homes compared to last year, but inventory is still not as plentiful as in years past.”
The second estimate for fourth quarter 2023 real gross domestic product (GDP) showed a downwardly revised increase of 3.2%, compared to the first estimate of 3.3%. GDP grew at a 4.9% rate in the third quarter of 2023 and gained 2.5% for the year. This 2.5% figure is greater than the 1.8% that Federal Reserve officials consider to be non-inflationary growth.
COLLATERALIZATION
All funds under the control of this office requiring collateralization were secured at rates ranging from 100% to 110%, depending on the type of investment.
PAYMENTS, FEES AND COMMISSIONS
Securities were purchased or sold utilizing competitive bidding. Bank fees and money market mutual fund operating expenses are detailed in the attached pages, as is the earnings split between the State Treasurer and the master custodian bank on securities lending income.
Best regards,