| PORTFOLIO PERFORMANCE, DIVERSIFICATION, AND STRATEGY November portfolio yielded 3.43%, up from 2.97% last year, with a weighted average maturity of 951 days. Total assets under management of $15.66 billion, in comparison to $15.67 billion a year ago. Total portfolio contained 73.6% in U.S. Treasurys, 3.4% in U.S. government agencies, 13.9% in mortgage-backed securities, 8.0% money market mutual funds, 0.2% in certificates of deposit, and 0.9% in state bond issues and foreign bonds, comprising the balance of funds invested. |
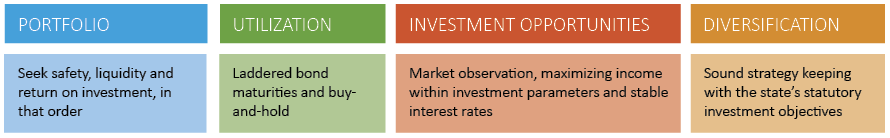
“Total portfolio yields are lower than current yields due to the laddered structure of the investments over a 3 year average.” STATE TREASURER, TODD RUSS |
 |
TOTAL FUNDS INVESTED Funds available for investment at market value include the State Treasurer’s investments at $12,386,183,601 and State Agency balances in OK Invest at $3,279,263,059, for a total of $15,665,446,660. |
| MARKET CONDITIONS |
Treasury yields declined in November. The 2-year and 10-year note yields fell -1.9% and -11.5% respectively to 4.15% and 4.17%. Yields moved down across the maturities as treasury security prices moved upward except for the one-year treasury bill. The yield curve, the visual relationship between yield rates and maturity dates, shifted downward at the end of the month. 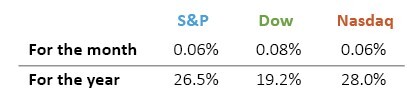 |
| Year to date, the S&P 500, Dow Jones, and Nasdaq have gained 26.5%, 19.2%, and 28.0% respectively. All three indexes rose in November. All three major indexes hit record highs in November. National elections and politics characterized the trades and movements across sectors in November. S&P Global writes the market, “digested the impact of potential future government policies, regulations and spending”. The S&P 500 and the Dow Jones closed the month at record highs. |
| As of the publishing date of this report, the market had a 25-basis point rate cut at the FOMC’s December 18th meeting Investors are pricing in their expectations to treasury security yields and prices, which move inversely, given another quarter point rate cut because of the normalizing statistics on labor and inflation data in line with expectations. |
ECONOMIC DEVELOPMENTS |
| In November the headline unemployment rate rose 0.1% to 4.2%. Non-farm payrolls added 227,000 jobs to the economy. The growth came from the depressed results of the October survey, affected by strikes and hurricane effects. The health care and social services and leisure and hospitality sectors contributed the most to November job growth. The October and September jobs reports were revised upward by a combined 56,000 jobs per the U.S. Bureau of Labor Statistics. The report signals balance in the labor market between supply and demand. |
| The consumer price index (CPI) rose to 2.7% for the year ending in November. Core CPI, which excludes volatile food and energy prices, increased 3.3% over the same period. Core personal consumption expenditures (PCE), the Fed’s preferred measure of inflation increased 2.8% over 12 months ending in October. The producer price index (PPI) increased 0.4% in November. The index for final demand goods increased 0.7% in November accounting for over eighty percent of the rise in PPI. The price index for chicken eggs jumped 54.6%, the largest contribution to the rise in prices for final demand goods. |
| Retail sales adjusted for seasonal variation rose 0.7% in November and was revised up to 0.5% for October. For the year ended in November, retail sales were up 3.8%. This month’s growth came in above expectations of 0.5% per The Wall Street Journal. The Census Bureau, who collects this data, writes that, “motor vehicle and parts dealers were up 6.5% from last year, while Nonstore retailers were up 9.8% from November 2023”. The robust advances in motor vehicle sales contributed the most to this month’s growth. MarketWatch reports, “the surge in sales stemmed from auto dealers ratcheting up incentives to move vehicles piling up on their lots”. Nonstore retailer sales growth represents online sales from internet retailers while continue to grow this holiday season. |
| In October, the National Association of Realtors reports existing home sales increased 3.4% to a seasonally adjusted annual rate of 3.96 million homes, up 2.9% from last year. Total housing inventory increased to 1.37 million, the equivalent of 4.2-month supply at the current sales pace. At the end of October, the average 30-year fixed rate mortgage was 6.72%, down 1.07% from a year ago. The median existing home sales price in October was $407,200 up 4.0% from last year. |
| The second estimate of third quarter gross domestic product (GDP) growth was 2.8% and was in line with expectations. This broad measure of economic activity was maintained over the quarter by healthy and persistent U.S. consumer spending. Compared to second quarter GDP growth of 3.0% (revised), Q3 saw slight drop in fixed investment and inventory growth. The Bureau of Economic Analysis reports, “the update primarily reflected upward revisions to private inventory investment and nonresidential fixed investment”. |
| COLLATERALIZATION All funds under the control of this office requiring collateralization were secured at rates ranging from 100% to 110%, depending on the type of investment. |
Best regards,  TODD RUSS View full report. TL_November_2024.pdf |

Dec 23
November 2024 Oklahoma Investment Report
Ron salutes our daily email sponsors!