

Final export commitment data for marketing year (MY) 2022/23 that ended May 31 is now available, providing an overview of the year’s export and demand trends.
In this article, we will look back on the MY 2022/23 demand trends and current MY 2023/24 data to provide context for the year to come as the world wheat market conditions continue to recover from the year’s volatility.
Since the start of 2022/23, wheat prices and freight decreased, and currency markets stabilized following the steep price shock of Mr. Putin’s unprovoked invasion of Ukraine. Despite the improved conditions, volatility and its consequences still reverberate through the U.S. and global wheat markets.
MY 2022/23 Year End Commercial Sales
Even with the year’s price risk, when ordinary hard red winter wheat exported from the Gulf of Mexico averaged $10.70/MT FOB, Mexico, the Philippines, Japan, South Korea, and Taiwan remained among the top U.S. wheat importers in 2022/23 and have consistently been among the leading importers over the last five years.
As U.S. wheat competitiveness began to improve early in calendar 2023, China entered the market, ultimately surpassing Taiwan to claim the number five spot as their purchases surged 38% above the year prior. Moreover, China became the world’s largest wheat importer with the June World Agricultural Supply and Demand Estimates (WASDE) putting Chinese wheat imports at a record 14.0 MMT.
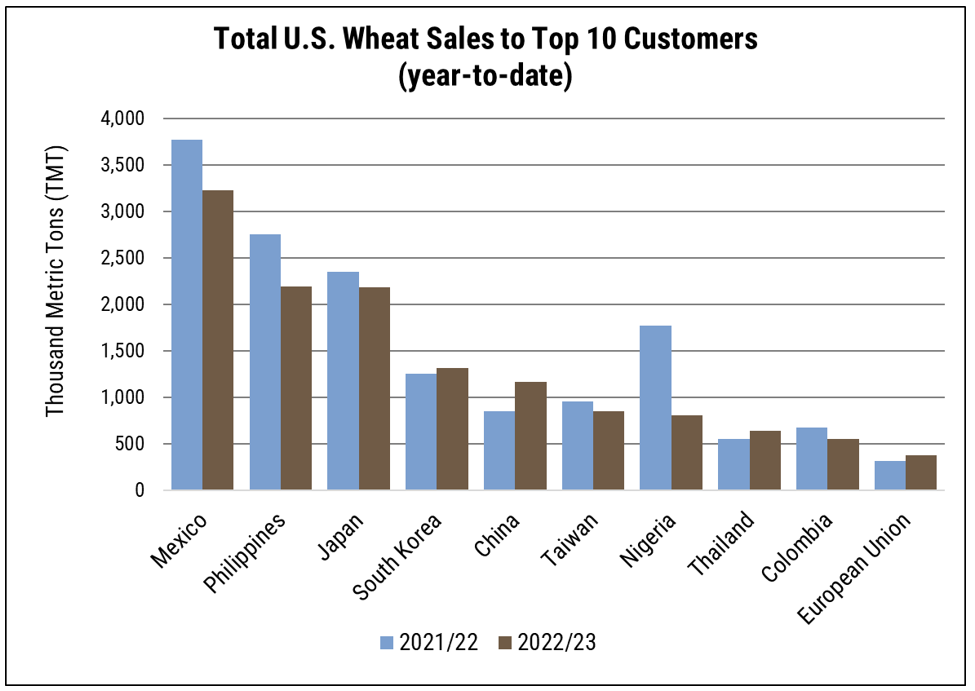
Mexico, the Philippines, Japan, and South Korea have been consistently among the top five U.S. wheat importers. In 2022/23, China became the world’s largest wheat importer, surpassing Taiwan to claim the fifth-place spot among U.S. wheat importers. Source: USW Commercial Sales Report/USDA Export Sales Data.
Hard red winter (HRW) wheat sales were 32% behind 2021/22, a function of high prices driven by drought and exacerbated by the war risks. Hard red spring (HRS) sales were up 4% following the drought in 2021/22 that severely diminished the crop and put exports at their lowest level since 2008/09. Soft red winter (SRW) sales were nearly even with the year prior and 9% above the five-year average as SRW remained competitive on the global market. Following drought-stressed production in 2021/22, white wheat exports were up 35% at 4.5 MMT and tracking SRW trends. Durum sales were up 109% due to improved production increased sales to Algeria and the European Union.
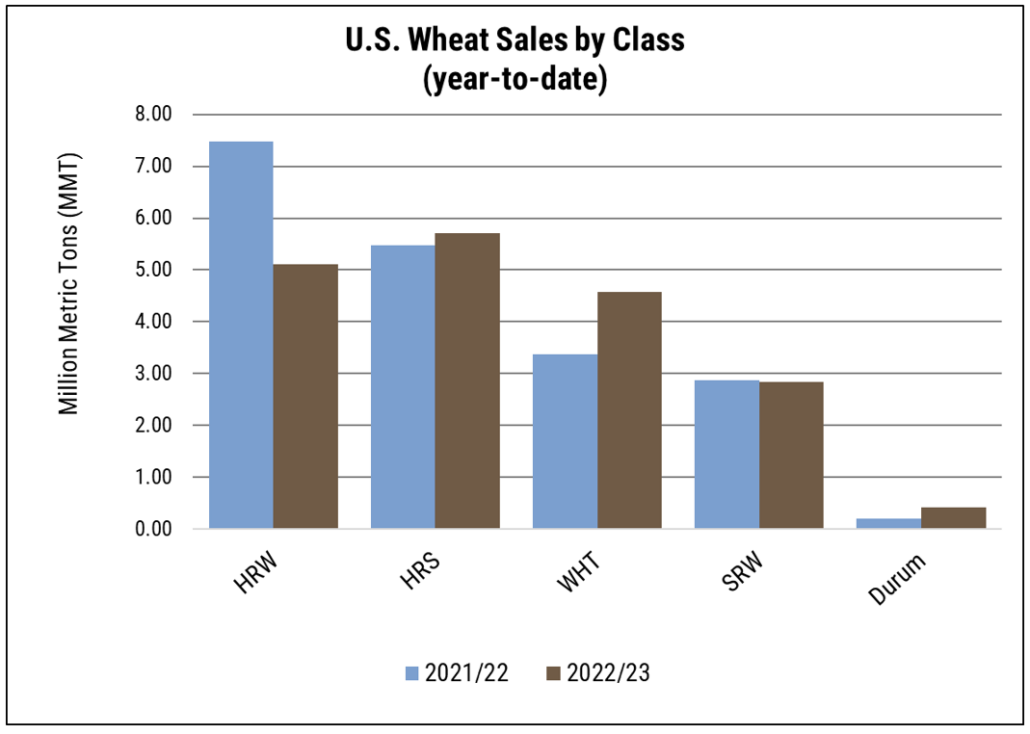
Some classes saw improved export sales year-over-year despite an overall reduction in demand. HRW wheat sales were 32% behind 2021/22, HRS was up 4%, SRW was nearly even with the year prior, white wheat was up 35% and durum was up 109%. Source: USW Commercial Sales Report/USDA Export Sales Data.
MY 2023/24 to Date
Demand has been relatively light so far in MY 2023/24 as many buyers delay purchasing decisions for more concrete information about the upcoming harvest and price fundamentals. Adding optimism for importers are recent rains in the U.S. Plains that have helped boost winter wheat crop ratings and rapid planting progress in HRS production areas.
Overall, U.S. wheat commercial sales are down 18% from last year’s pace at 3.9 MMT. Even so, customers in Japan, South Korea, and Taiwan are ahead of their 2022/23 pace, and SRW commitments have surpassed last year’s level by 18% given its competitive price advantage.
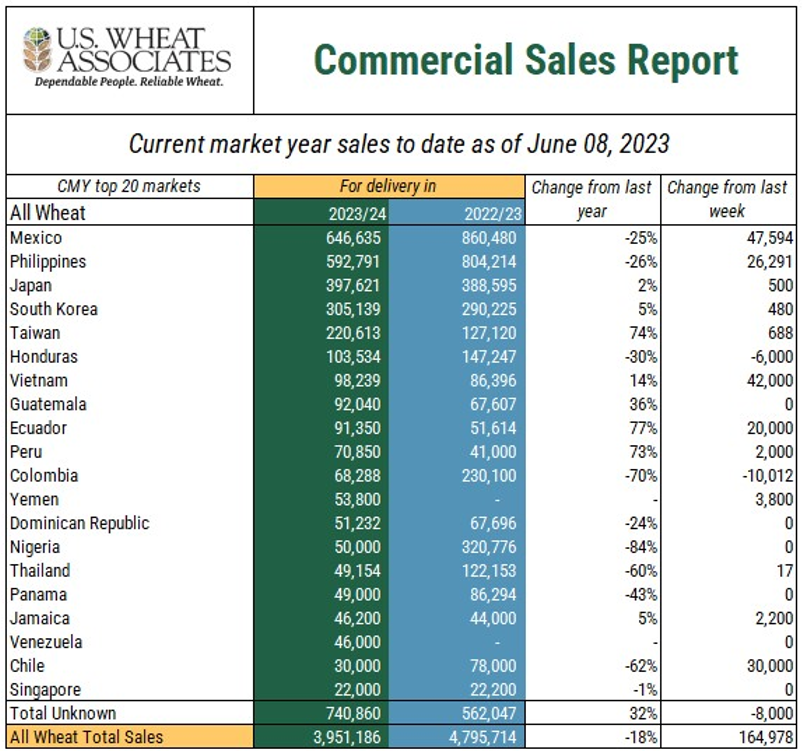
Year-to-date marketing year 2023/24 commercial sales total 3.9 MMT, down 18% from the year prior. Meanwhile, purchases in Japan are 2% ahead of last year, South Korea up 5% and Taiwan up 75%. Vietnam, Guatemala, Ecuador, and Peru have also surpassed last year’s pace, highlighting how the market sentiment has shifted from a year ago. Source: USW Commercial Sales Report/USDA Export Sales Data.
New 2023/24 Estimates
Meanwhile, the June WASDE released on June 9 reported significant increases in world production estimates and ending stocks; however, the increases were unsurprising, leaving futures prices little changed.
World wheat production increased 10.4 MMT from the May estimates to 800.2 MMT on improved output in Russia, India, and the EU. World consumption increased by 4.4 MMT to 796.1 MMT, accounting for increased feed use in China, Russia, and India. Ending stocks increased to 270.7 MMT due to large projected stocks in India, Russia, and the EU. The estimates were also subdued on the domestic front, raising production by 100,000 MT, and increasing ending stocks by 200,000 MT with no other changes to the U.S. balance sheet.
Keep Up To Date
Though it is still very early in MY 2023/24, analyzing past trends and the monthly supply and demand updates helps provide context to aid purchasing decisions. Compared to this time last year, many influences have turned to favor wheat importers, though the war in Ukraine and weather patterns throughout the global wheat growing region add underlying risk. With risk still ever present, information is vital for planning and executing purchases. You can stay current on the latest reports via the U.S. Department of Agriculture and the U.S. Wheat Associates weekly Commercial Sales and Price Reports.
By U.S. Wheat Associates (USW) Market Analyst Tyllor Ledford