


The Inventory of U.S. Greenhouse Gas Emissions and Sinkshas been published annually by the Environmental Protection Agency since 1990. It provides an annual estimate of all man-made greenhouse gas emissions sources in the U.S. as well as estimates of the amount of carbon trapped in forest and vegetation soil. This report is submitted to the United Nations as part of the United Nations Framework Convention on Climate Change reporting guidelines on annual inventories, which is part of a global standardized process for reporting greenhouse gas emissions. Previous Market Intel articles have reviewed the emissions for 2017 (Agriculture and Greenhouse Gas Emissions), 2018 (Agriculture’s Greenhouse Gas Emissions and Sinks), 2019 (Previewing 2019 Agricultural Emissions) and 2020 (2020 EPA Emissions Inventory Demonstrates Agriculture’s Advancements in Sustainability), as well as trends in carbon sequestration (Reviewing U.S. Carbon Sequestration).
Once again, U.S. agriculture represents just 10% of total U.S. emissions when compared to other economic sectors. Overall U.S. greenhouse gas emissions increased from 2020 to 2021 by 5.2%, though agricultural emissions dropped 0.2%. The likely cause of this year-over-year increase is the return of economic activity after a portion of initial COVID-19 lockdowns were lifted. With the slow return of food service, entertainment and travel came the emissions associated with those activities. Agricultural production remained vital throughout the COVID-19 disruptions and lockdowns as the world still required food.
The report emphasizes how voluntary, market- and incentive-based conservation practices help farmers and ranchers access finances for the research and technology needed to continue to take care of their natural resources.
Today’s article provides an overview of 2021 emissions as detailed in EPA’s Inventory of U.S. Greenhouse Gas Emissions and Sinks: 1990-2021 report, which was published on April 13. It is important to note, each year EPA updates the methodologies used for their estimations and retroactively applies this updated methodology to all years since 1990. This means that data in this iteration of the report is not necessarily comparable to the values reported last year.
2021 Emissions and Sinks
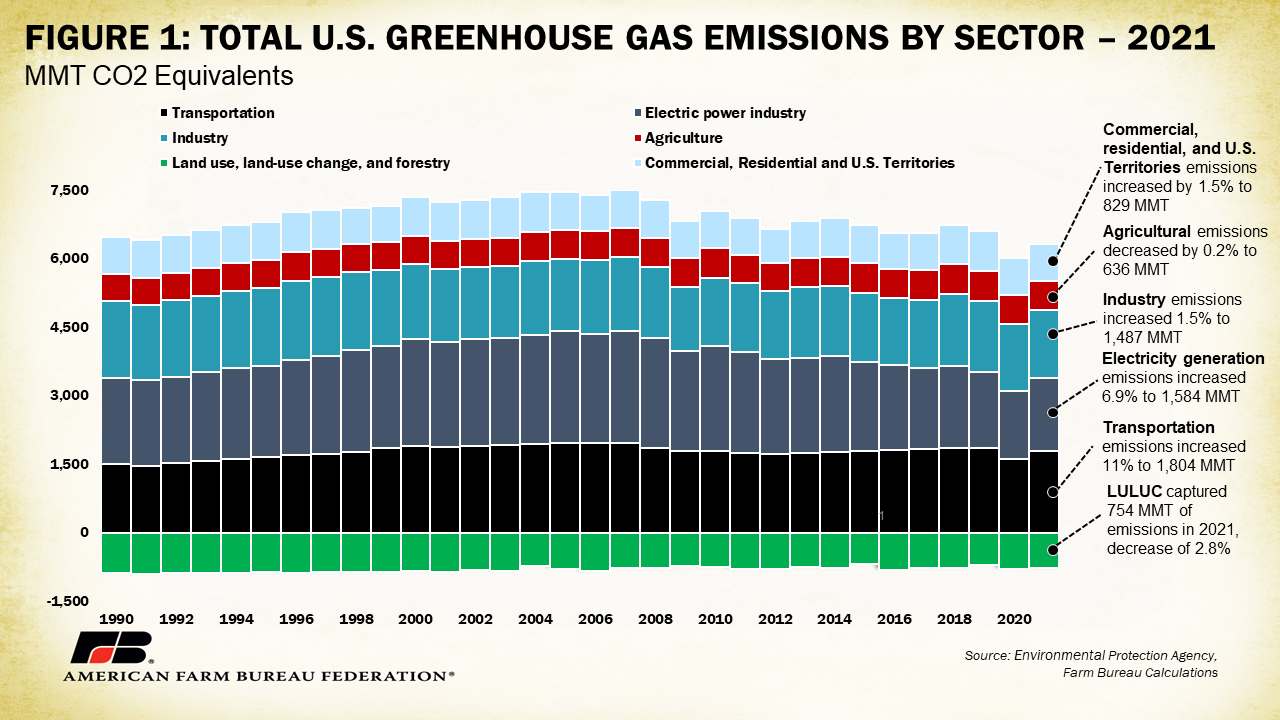
In 2021, EPA reports that the total U.S. emissions from all man-made sources was 6.3 billion metric tons in CO2 equivalents, which is an increase of 314 million metric tons compared to 2020 when U.S. emissions totaled 6 billion metric tons in CO2 equivalents. Land use, land-use changes and forestry (LULUC) trapped 754 million metric tons of carbon in the soils, representing 11.8% of total U.S. emissions. 2021 net emissions, which combine total U.S. greenhouse gas emissions with the sequestered greenhouse gas emissions, totaled 5.6 billion metric tons, up 6.4% from 2020. Again, this increase is likely linked to the rebound of economic activity after initial COVID-19 economic disruptions.
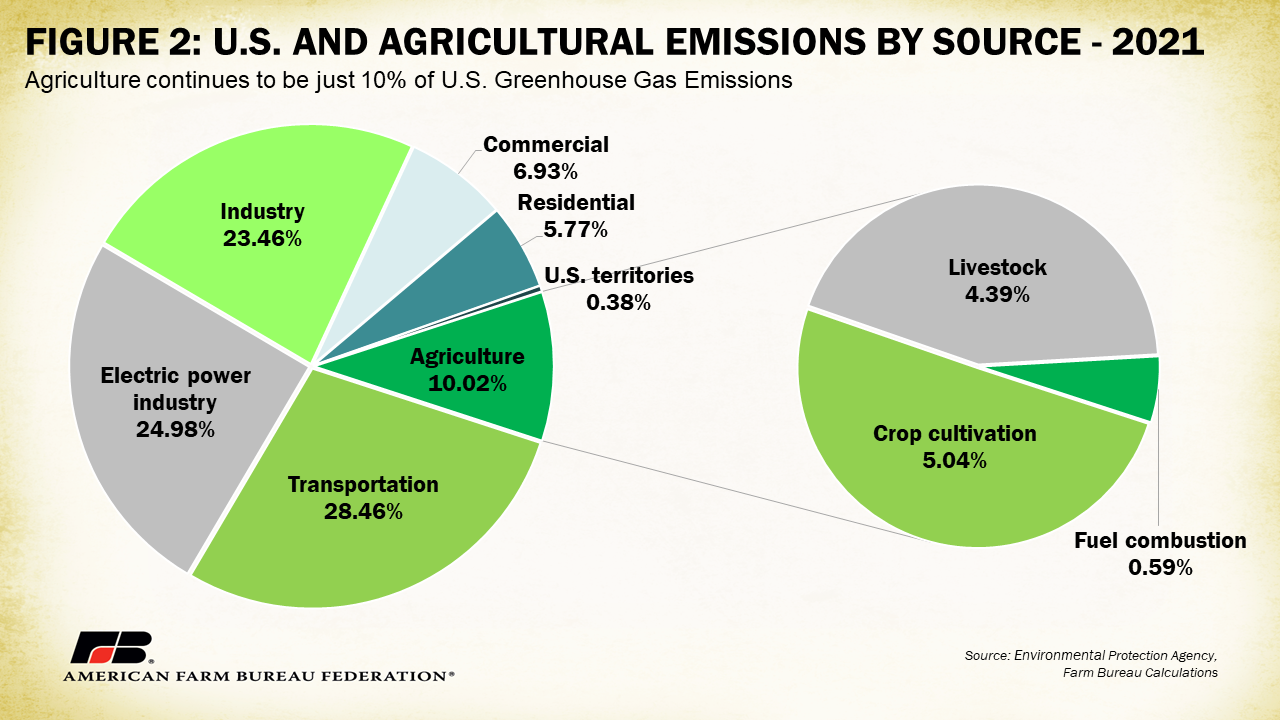
The largest emissions source was the transportation sector, representing 28% of total emissions and totaling 1.8 billion metric tons. Transportation emissions increased 11%, or 179 million metric tons, from the prior year, largely a result of the return of travel after many pandemic restrictions were lifted. Following transportation, electricity generation represented 25% of total emissions at 1.6 billion metric tons. Emissions from the electric power industry were up 6.9% from 2020 after a 10.2% reduction compared to 2019. Similar to the transportation sector, an increase in economic activity after initial COVID-19 lockdowns contributed to increased demand for electrical generation for things like manufacturing and heating and cooling of re-opened facilities. The industrial sector, which includes the production of iron and steel, as well as other input materials like cement, represented over 23% of all emissions at 1.5 billion metric tons. Emissions from the industrial sector increased 1.5% compared to 2020. The commercial and residential sectors and U.S. territories represented 12.7% of all U.S. emissions, increasing 1.5% compared to 2020, again linked to the return of increased economic activity. U.S. territory emissions, including emissions from American Samoa, Guam, Puerto Rico, the U.S. Virgin Islands and Northern Mariana Islands, make up only 0.4% of total emissions.

Agricultural Emissions in 2021
By EPA’s own methodology, emissions from agriculture totaled 636 million metric tons in CO2 equivalents, or 10.02% of all U.S. emissions, during 2021. This represents a decrease of 0.2%, or 1.43 million metric tons, from 2020. This follows a 2.7%, or 18-million-metric-ton, drop between 2019 and 2020 and a 2.2%, or 15-million-metric-ton, drop between 2018 and 2019. EPA further categorizes agricultural emissions by crop cultivation, livestock and fuel combustion. In 2021, crop cultivation emissions totaled 319 million metric tons, up 1%, or 2.89 million metric tons, from 2020 and just over 5% of total emissions. At 4.4% of total emissions, livestock emissions were 278 million metric tons, down 1%, or 2 million metric tons, from 2020. Fuel combustion utilized by the agricultural sector contributed 38 million metric tons in 2021, down 2.2 million metric tons, or 6%, from 2020, a mere 0.6% of total emissions.

For livestock categories specifically, enteric emissions from beef cattle sit at 2.19% of total U.S. emissions, or 139 million metric tons of the 6.34 billion metric ton total. This is a 1%, or 1.31-million-metric-ton, decline from 2020. Dairy cattle contributed only an additional 0.77% to total emissions or 49 million metric tons – a marginal 290,000-metric-ton increase from 2020. Swine, sheep and horses were a mere 0.05%, 0.02% and 0.02% of the total, respectively.
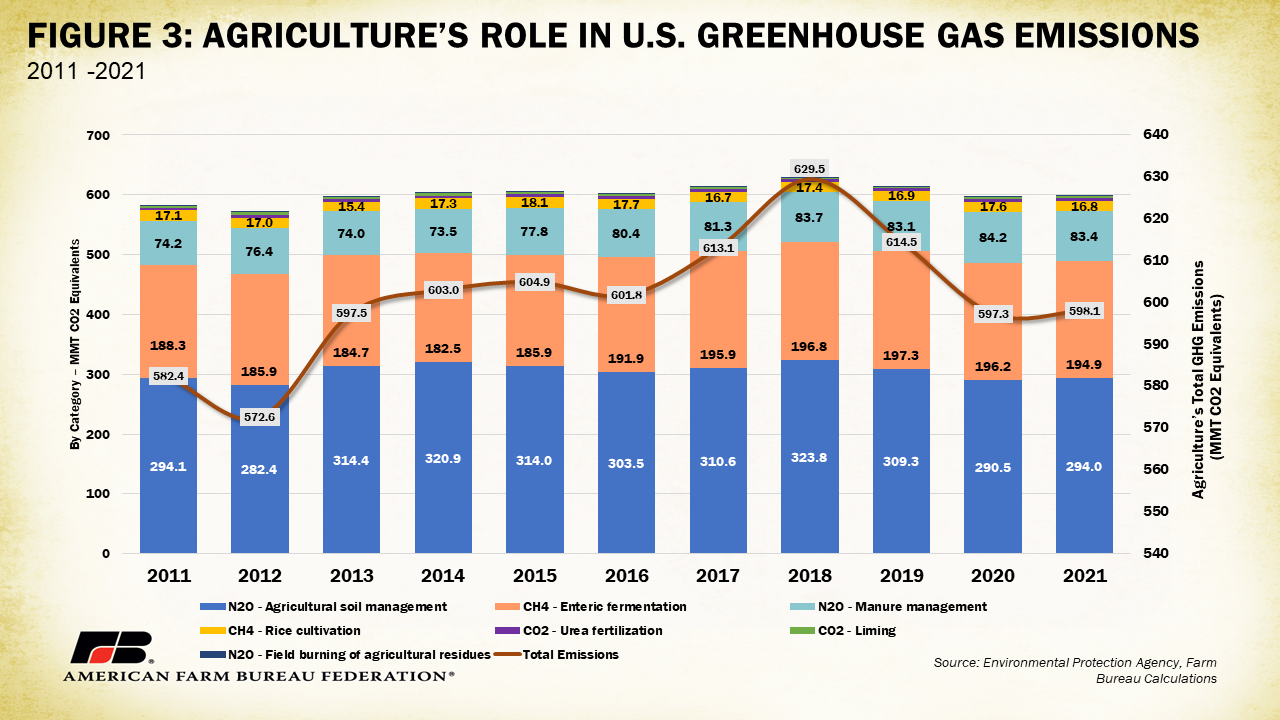
EPA also estimates agricultural emissions using a second methodology consistent with those of the Intergovernmental Panel on Climate Change. By this measure, U.S. agricultural emissions for 2021 totaled 598 million metric tons, up 0.1%, or 830,000 metric tons, from 2020, representing 9.4% of all U.S. greenhouse gas emissions. This methodology breaks down agriculture into additional categories not considered in the base methodology. In this data set, the largest source of U.S. agricultural emissions was agricultural soil management, e.g., fertilizer applications or tillage practices, at 294 million metric tons, a 3.5-million-metric-ton, or 1%, increase. Agricultural soil management represents approximately 50% of all agricultural emissions, but only 4.6% of total U.S. emissions.
Following agricultural soil management, livestock-related emissions from enteric fermentation and manure management contributed 195 million metric tons and 83 million metric tons, respectively, to total U.S. emissions. These two emission sources represented 46% of agricultural emissions, but only 4.4% of total U.S. emissions. Other agricultural emissions sources include methane from rice cultivation at 17 million metric tons, CO2 from urea fertilization at 5.2 million metric tons, CO2 from liming at 3 million metric tons, and CO2 from field burning at 0.6 million metric tons. Combined, these remaining categories represented less than 5% of agricultural emissions and 0.4% of U.S. emissions.

Agricultural Productivity and Emission Trends
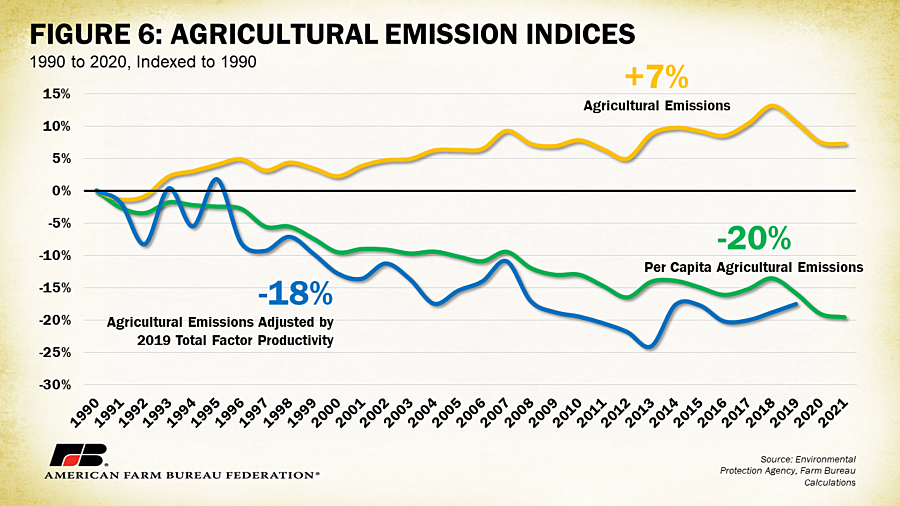
A comparison of 2021 emissions to 1990 emissions shows U.S. agricultural emissions have increased by 7%. However, that’s not the full story. Productivity is increasing, as it must to help feed a growing global population, while emissions are on the decline relative to this productivity and population increase. Innovation and advancements in technology have allowed farmers and ranchers to increase their productivity while using the same amount of inputs. Compared to 1948, farmers and ranchers are producing 2.78 times more in output per unit of input they use, according to USDA-Economic Research Service’s estimations of farm output, input and total factor productivity (Agricultural Productivity in the U.S.). Even more impressive, productivity is rising while cropland is declining – by 30 million acres over the last three decades. This means that farmers and ranchers continue to produce more using fewer resources and the additional decrease in agricultural emissions shows that voluntary, market-based incentives are helping farmers and ranchers accomplish this milestone.
For agriculture, production of food is important not just for farmers and ranchers, but also for the millions of families in the U.S. and around the world that U.S. agriculture feeds. Agriculture has been remarkable at sustainable intensification through productivity gains, in addition to adding practices that further shrink its environmental footprint. These improvements have been in crop yields and animal nutrition and breeding. Such productivity growth and the agricultural research that drives it are critical to the sustainability of agriculture’s contribution the world’s food, clothing and energy needs.
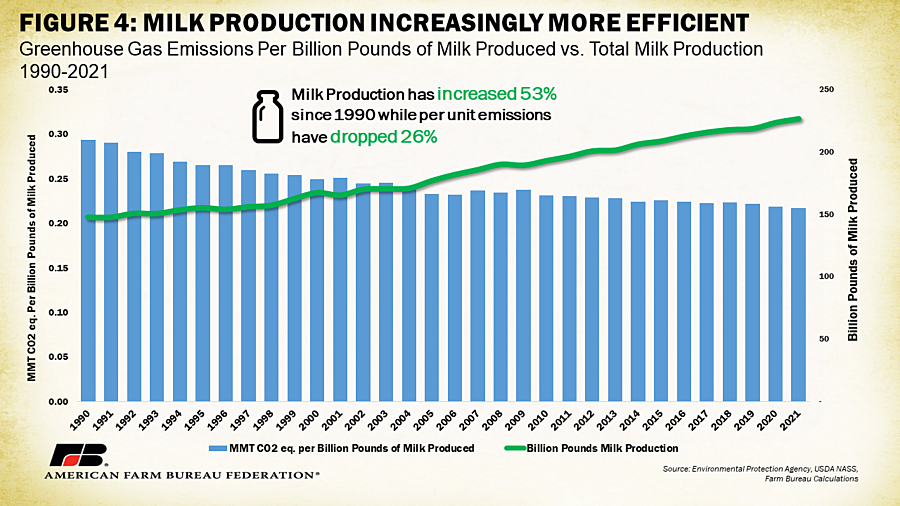
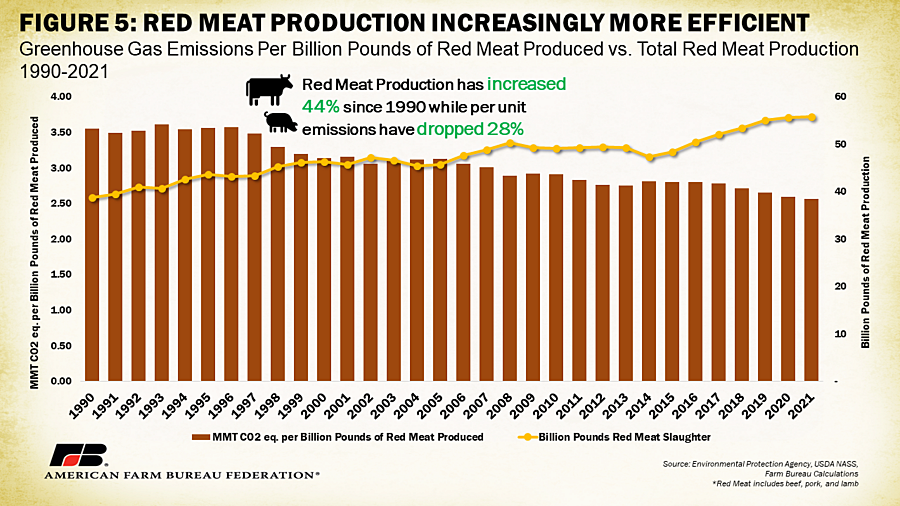
For instance, consider two examples: milk production and red meat production, which includes cattle, swine and sheep raised for meat. Since 1990, U.S. dairy farmers have increased milk output by 53%, going from 148 billion pounds to 226 billion pounds as global demand for products like cheese, butter and dairy powders rises with a growing world economy. During this same timeframe, enteric fermentation from dairy cattle per billion pounds of milk produced has dropped 26%, from 293 million metric tons to 217 million metric tons per billion pounds of milk produced. Similarly, global demand for red meat products continues to rise and farmers have met the challenge in a more efficient manner. In 1990, U.S. farmers produced 39 billion pounds of red meat; this grew 44% to 55 billion pounds in 2021. In the same timeframe, enteric fermentation from beef cattle dropped 28%, from 3.5 million metric tons to 2.5 million metric tons per billion pounds produced. This shows how livestock producers have embraced technological innovation and production practices that increase output while reducing associated emissions.
Not only have producers focused on improvements to production and sustainability, but they have also focused on feeding more families, in the U.S. and globally. Since 1990, U.S. agricultural emissions have increased by 7%, but the U.S. population has increased 33% in that same period of time, adding over 83 million people in three decades. This means U.S. agriculture has been called upon to feed more people than ever before. With the advancements in innovation and technology, agricultural emissions per capita have declined 20% since 1990. Adjusting for productivity gains within the sector, the 7% increase in agricultural emissions drops to an 18% decline since 1990 (latest available productivity data is 2019).
Summary and Policy Conclusions
During 2021, U.S. greenhouse gas emissions from all man-made sources totaled 6.3 billion metric tons in CO2 equivalents, an increase of 5.2% from 2020, largely due to the return of commerce after a COVID-19-induced slowdown in 2020. When taking into consideration carbon trapped in the soils through forestry, grasslands, wetlands and cropland, U.S. greenhouse gas emissions were reduced by almost 12% to a net emissions level of 5.6 billion metric tons. Emissions related to agriculture totaled 635 million metric tons during 2021, down a slight 0.2% from the previous year.
Based on Intergovernmental Panel on Climate Change methodology, U.S. agricultural emissions totaled 598 million metric tons in 2021, a 6% increase compared to 2020. As a percentage of total U.S. emissions, U.S. agriculture continues to be just 10% of all greenhouse gas emissions, with livestock-related emissions about 3%.
When factoring in productivity and population gains, however, both per unit and per capita agricultural emissions are declining. That means U.S. agriculture is producing more food, fiber and renewable fuel for more people while using fewer resources and emitting fewer greenhouse gases. Additionally, the adoption of conservation practices through voluntary, market-based incentives have helped farmers and ranchers trap 754 million metric tons of carbon in the soil.
With conversations on a new farm bill in full throttle, it is vital that additional investments to assist farmers in further improving efficiency are prioritized. Demand for working lands programs like the Environmental Quality Incentives Program and Conservation Stewardship Program, which have allowed private land to continue in production and have helped to provide cost-share assistance to implement conservation practices, has consistently outpaced the amount of funding authorized by the farm bill. Ensuring that the United States leads in agricultural research that allows farmers and ranchers to be part of cutting-edge plant and animal technologies that increase productivity, capture more carbon in the soil and reduce livestock-related emissions even more, among many other environmental benefits, is also vital.
The latest report shows that when agriculture is recognized as a partner in reducing greenhouse gas emissions, farmers and ranchers have more opportunities to utilize voluntary, market-based incentives that work to reduce agriculture’s environmental footprint while helping farmers and ranchers economically produce the food, fiber and renewable fuel U.S. families, and the world, rely on.


