
The August Crop Production report from USDA-NASS included forecasts for 2026 hay production. The hay crop year runs from May – April so the total hay supply includes May 1 carryover hay stocks plus current year production. Total U.S. May 1 hay stocks were up 19.5 percent year over year, but total hay production is expected to be down 9.3 percent leading to a 7.2 percent decrease in the 2026 total hay supply (Table 1).
Table 1 shows the top ten states for each category: May 1 Stocks, All Hay Production, Alfalfa Hay Production and Other Hay Production. The top ten states for May 1 stocks accounted for 62.6 percent of total May 1 stocks with stocks higher year over year for each of the ten states. Total May 1 stocks were up 19.5 percent over the 2015-2024 average.
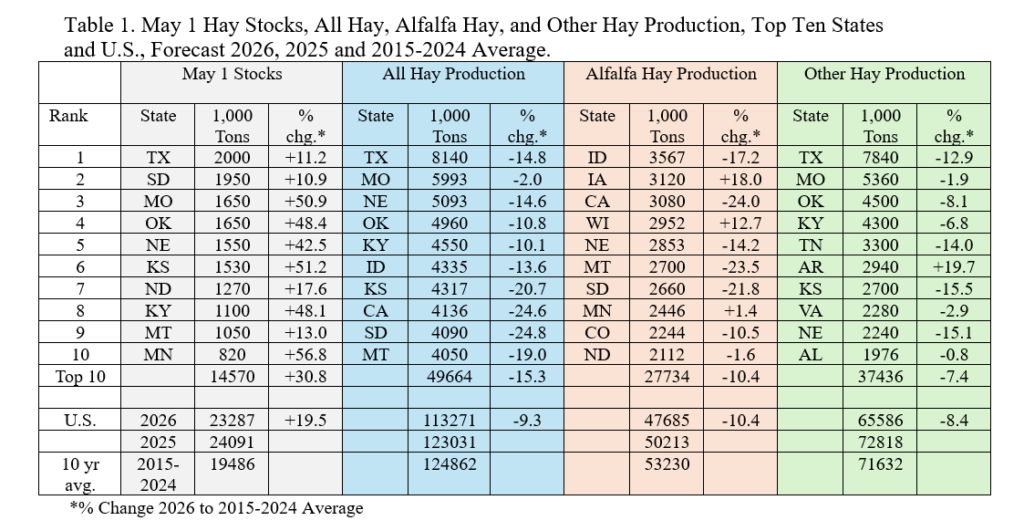
Total U.S. hay production in 2026 is expected to be down 9.3 percent from the 2015-2024 average and down 7.9 percent year over year. All of the top ten hay production states are down individually and the group is down 15.3 percent from the ten-year average while accounting for 43.8 percent of total U.S. hay production.
The top ten states for alfalfa hay production are mostly northern beef cow states and/or big dairy states with 2026 alfalfa hay production down 10.4 percent from the ten-year average. These states accounted for 58.2 percent of total U.S. alfalfa hay production. Alfalfa hay production was down in seven of the top ten states but up in Iowa, Wisconsin and Minnesota. Total U.S. alfalfa hay production is forecast down 10.4 percent from the ten-year average and down 5.0 percent year over year.
Total 2026 other hay production is forecast to be down 8.4 percent from the ten-year average and down 9.9 percent from last year. The top ten states for other hay production account for 57.1 percent of total other hay production. Nine of the ten largest other hay producing states are down from the ten-year average with the increase in Arkansas the sole exception.
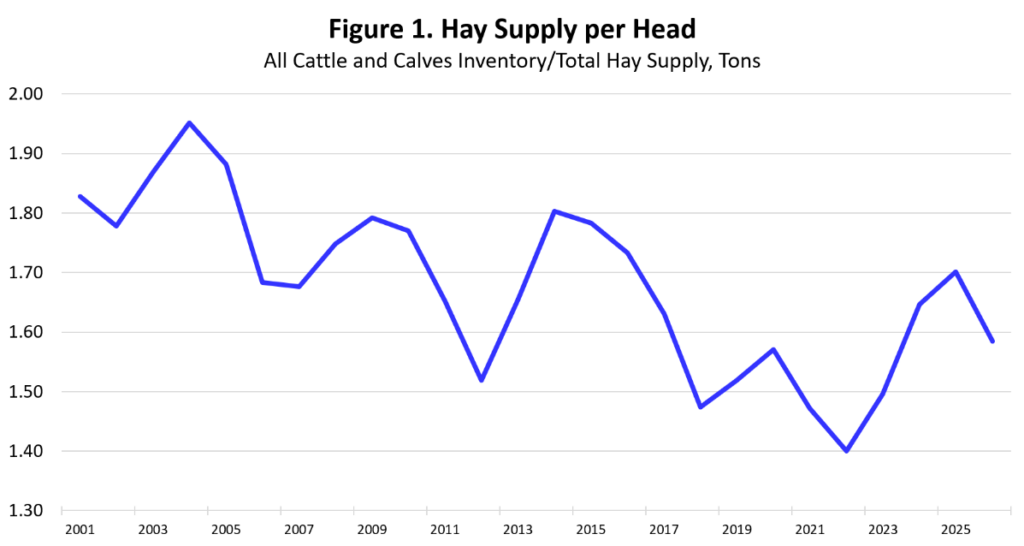
A broad measure of the relative hay situation is the hay supply per head of cattle (Figure 1). Figure 1 shows total annual hay supply divided by the January 1 inventory of all cattle and calves. For 2026 the hay supply per head is 1.59 tons, down from last year but about equal to the average of the past 15 years.