

In the latest Newsletter from OSU’s Todd Hubbs he says the release of USDA’s Crop Production and WASDE reports on Tuesday saw NASS continue to vacillate on national corn yield and confirmed the underlying fundamental factors moving grain and oilseed markets recently. Global stocks for feed grains and wheat remain robust and point towards muted price action over the near term.
Wheat Market Outlook: USDA projected increased wheat production and ending stocks for the world in November’s WASDE report. Wheat prices moved higher after the reports on spillover support from corn and soybeans only to retreat in the face of the underlying data. USDA lowered exports on the hard red winter wheat balance sheet, confirming the recent slow pace. All wheat exports remained unchanged as white wheat export levels increased to make up for HRW and hard red spring wheat reductions. Black Sea export projections dropped once again due to a slow pace while Argentina and Australian exports moved higher on greater production. December HRW futures prices closed Monday up two cents at $6.34 per bushel. The July 2027 future price ended the day at $6.47, up two cents. Cash prices in Oklahoma still show basis at -55 to -70 under depending on location.
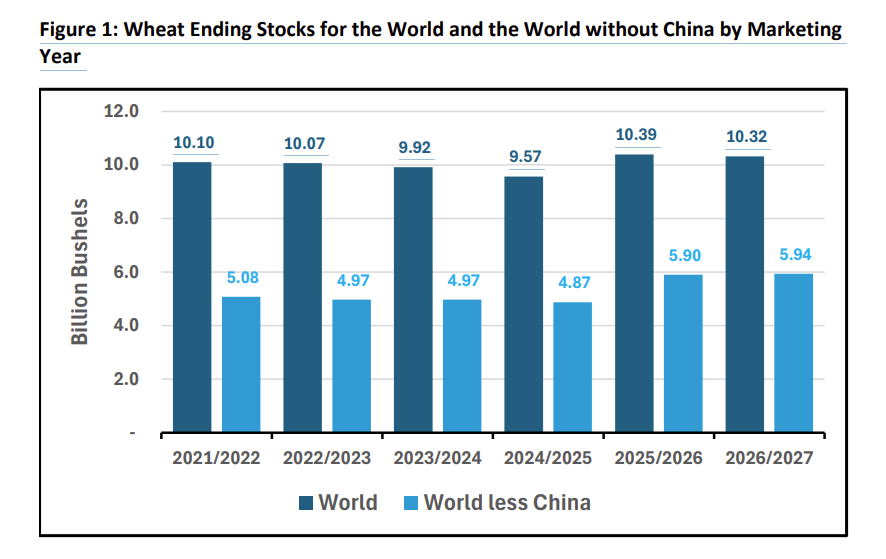
The global wheat production forecast came in at 30.4 billion bushels with larger crops forecast for Australia, Argentina, and Turkey providing the majority of the 188 million bushels increase. Increased production for Southern Hemisphere crops confirms speculation on the conditions in those regions and sets up a competitive export environment over the next two quarters. Global ending stocks less China increased to 5.9 billion bushels as shown in Figure 1. While overall stocks are down slightly, major exporter stock levels are up year over year.
The HRW balance sheet saw ending stocks increase 11 million bushels on lower exports for the marketing year. Total usage sits at 579 million bushels, down 198 million bushels from last marketing year. Supply is down 291 million bushels from last year; the lower usage and export levels fit with the global picture at present. HRW total commitments in the 2026-27 marketing year sit at 91 million bushels through October 29. HRW exports require 2.5 million bushels of net sales and shipments a week to meet USDA’s 165-million-bushel forecast. Over the last month, HRW net sales averaged 2.6 million bushels per week. Gulf port prices for HRW continue to converge on prices seen from global competitors and recent weekly net sales picked up to average 3.4 million bushels per week over the prior fortnight. Increased production forecasts for southern hemisphere producers support the ten million bushels weaker export projection. Along with continued negotiations to the Black Sea dispute, major price rallies may be fleeting.
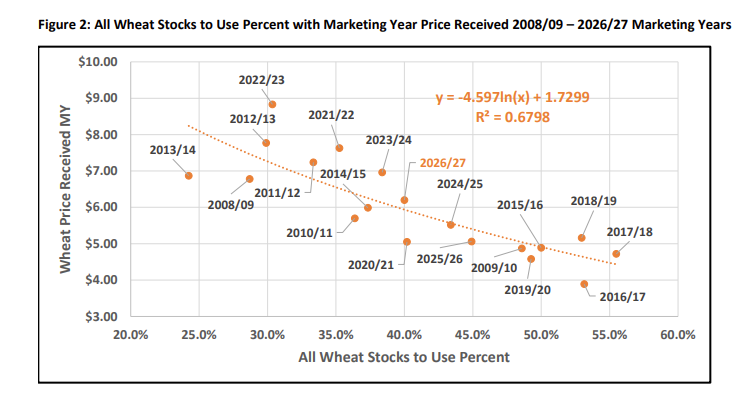
The all-wheat price received was lowered ten cents in the WASDE to $6.20 per bushel. As shown in Figure 2, stocks to use relationships with final price received for a marketing year possess a definite if sporadic relationship. At present, the ratio suggests a price received near $6 for this marketing year and the potential for further deterioration remains acute given global wheat fundamentals and recent data on cash price received by farmers.
Corn/Milo Market Outlook: The December corn future price closed on Monday at $4.49 per bushel, up ten cents on USDA reports. Cash prices in Oklahoma are $4.96 – $5.13. The minor price rally reflected the drop in production and subsequent adjustments to the balance sheet from the November reports. A continuation of the rally in the corn market seems unlikely given overall fundamentals taking shape around the globe. Crop developments in South America, particularly with the second corn crop in Brazil, provide the next major rally point looking forward.
U.S. corn yield was projected at 179.6 bushels per acre in the November Crop Production report. Corn production totaled 15.9 billion bushels, down 150 million bushels. Corn yields in the high Plains, upper Midwest, and the eastern Corn Belt came in lower from last month with Illinois corn yield dropping 8 bushels per acre to 200 particularly standing out. The corn balance sheet saw total usage drop 50 million bushels on a 25 million bushel each lowering of exports and feed usage. U.S. ending stocks dropped 91 million bushels to 1.76 billion bushels and pushed the stocks to use ratio down to 10.8 percent. The ratio remains above the bullish indicator signal of 10 percent.
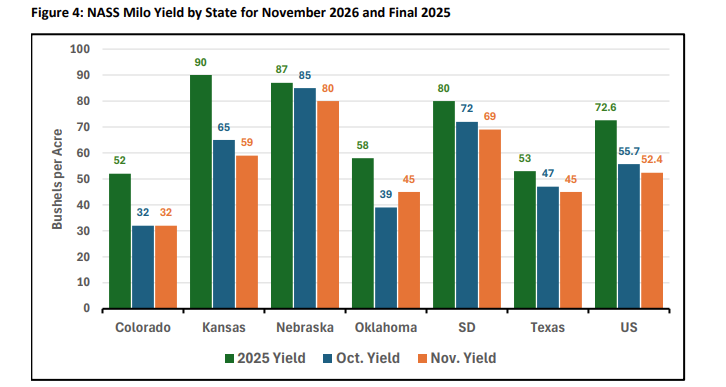
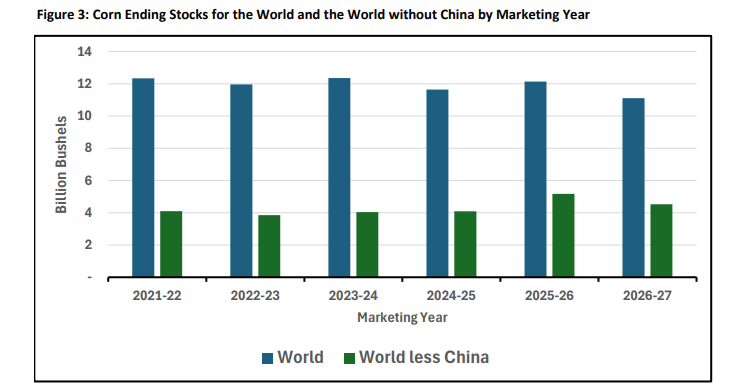
Figure 3: Corn Ending Stocks for the World and the World without China by Marketing Year Global corn production was projected lower by 86 million bushels at 51.06 billion for 2026-27, with cuts for the United States outweighing increases for Brazil and Argentina. Global exports came in slightly down as lower exports out of Ukraine and the U.S. made up for increased export expectations out of Argentina. As shown in Figure 3, world ending stocks total 11.1 billion bushels, up approximately 60 million bushels. World ending stocks less China totaled 4.5 billion bushels, down 13 million bushels from last month but down 645 million bushels from last marketing year. Overall, the global picture changed moderately on the smaller U.S. crop with any deterioration in production prospects in South America setting up potential upside volatility next year.
Milo production came in at 274 million bushels, down 16 million from last month and 163 million from last year. Yield was projected at 52.4 bushels per acre, down 2 bushels from last month. Figure 4 shows milo yield from the major producing states. Kansas, by far the largest producing state, dropped six bushels from last month and drove the lower national yield. Oklahoma, unexpectedly, increased six bushels per acre to 45.
The milo balance sheet lowered exports by 35 million bushels for the 2026-27 marketing year from last month to 125 million. The slow start to the marketing year and lack of Chinese buying supports this move. Recent market rumors indicated potential milo buying but the actual sales and exports have yet to materialize. While exports were lowered, feed and residual usage for milo was raised 10 million bushels to 70 million despite a substantial drop in production. Both feed and ethanol usage for ethanol could see increases over the remainder of the marketing year without Chinese buying materializing. Ending stocks are currently projected at 34 million bushels, up from 26 million last month. Given the corn market situation, milo prices in Oklahoma appear set to remain below corn prices for the near future. Milo cash prices sit at $3.40 – $3.80 around Oklahoma with prices lower depending on location. Cash milo prices sit at -70 to -1.10 below nearby corn futures price across locations in Oklahoma.