

The Congressional Budget Office’s (CBO) most recent Baseline for Farm Programs, released on May 12, identifies expected outlays for farm program spending, assuming existing programs continue without changes, and indicates program spending available to Congress as crafting of the 2023 farm bill kicks into high gear. CBO releases these projections on expected spending for farm programs for the 10-year baseline – the current budget year plus 10 years – up to three times a year.
Farm bill math creates a few possible scenarios. Depending on negotiations between the Budget and Agriculture committees, lawmakers crafting the next farm bill could be required to be budget neutral, meaning any increase in spending in one part of the bill would require a decrease in spending elsewhere in the bill; they could be required to have an overall net reduction; or they may be able to increase spending. Given such budget directives, scoring (estimating the additional outlays and potential savings relative to the baseline) is one of the most critical components of farm bill development. From now through the farm bill’s passage, any change in policy will require an estimate of the budgetary impact.
In general, the May report reveals only minor housekeeping adjustments compared to February’s release. Future policy proposals that arise during 2023 farm bill discussions will most likely be scored against these values. An analysis of the February CBO release can be found here.
Nutrition Spending Rises Again
The May CBO release includes updates to expected outlays for the Supplemental Nutrition Assistance Program (SNAP). In the February projections CBO increased its estimate of SNAP outlays by $8 billion (6%) for 2023 and by $93 billion (8%) between 2024-2033. This increase was linked to higher estimated program utilization as a result of higher unemployment as well as upward adjustments in expected food costs under the Thrifty Food Plan (TFP), which is utilized to estimate the cost of a healthy diet, including USDA’s choice to not make their 5-year updates of the TFP composition cost-neutral. With the May CBO release came another upward revision in these costs due to higher expected SNAP participation. For 2023 alone, projections moved from $127 billion to $145 billion, an $18 billion (14%) increase. Between the 10-year period of 2024-2033, the May release also forecasts an $18 billion cumulative increase, from $1.205 trillion to $1.223 trillion. Combined with other programs normally authorized in the farm bill, nutrition spending makes up over 81% of expected outlays. Nutrition revisions make up 56% of the total $31 billion increase between the February 2024-2033 projection and May 2024-2033 projection.
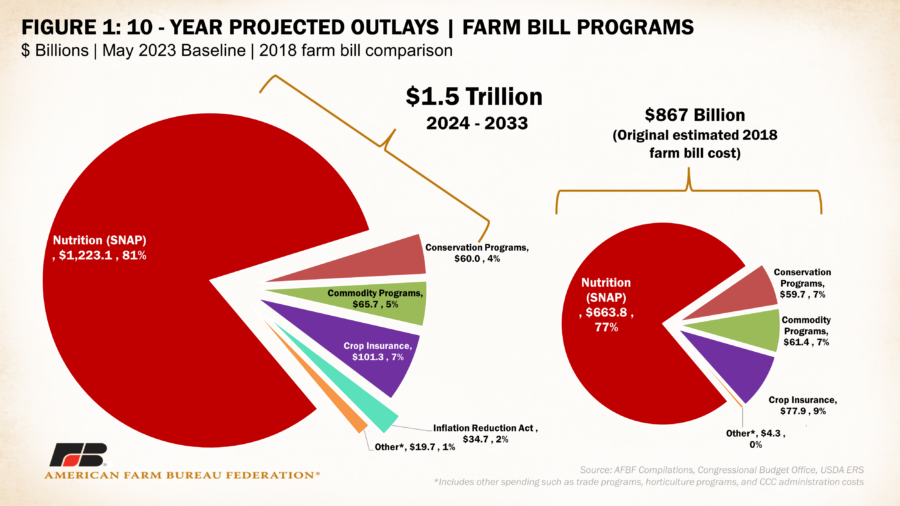
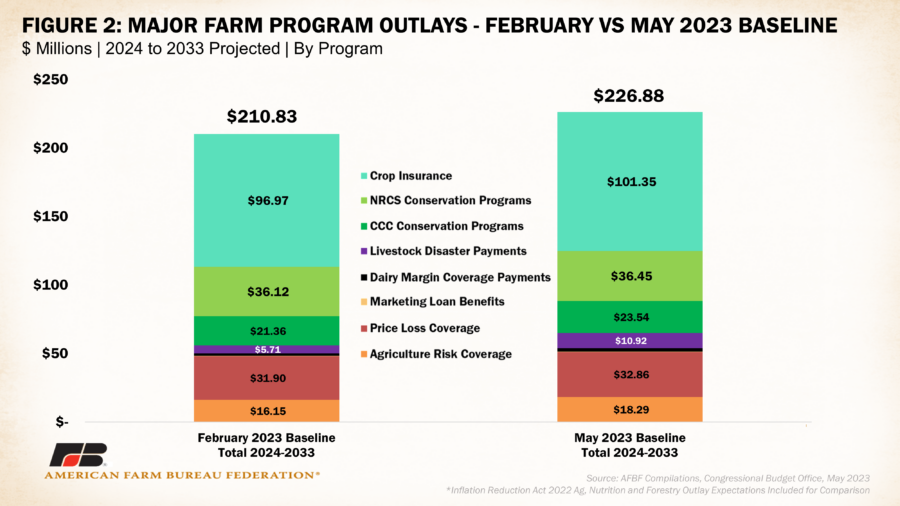
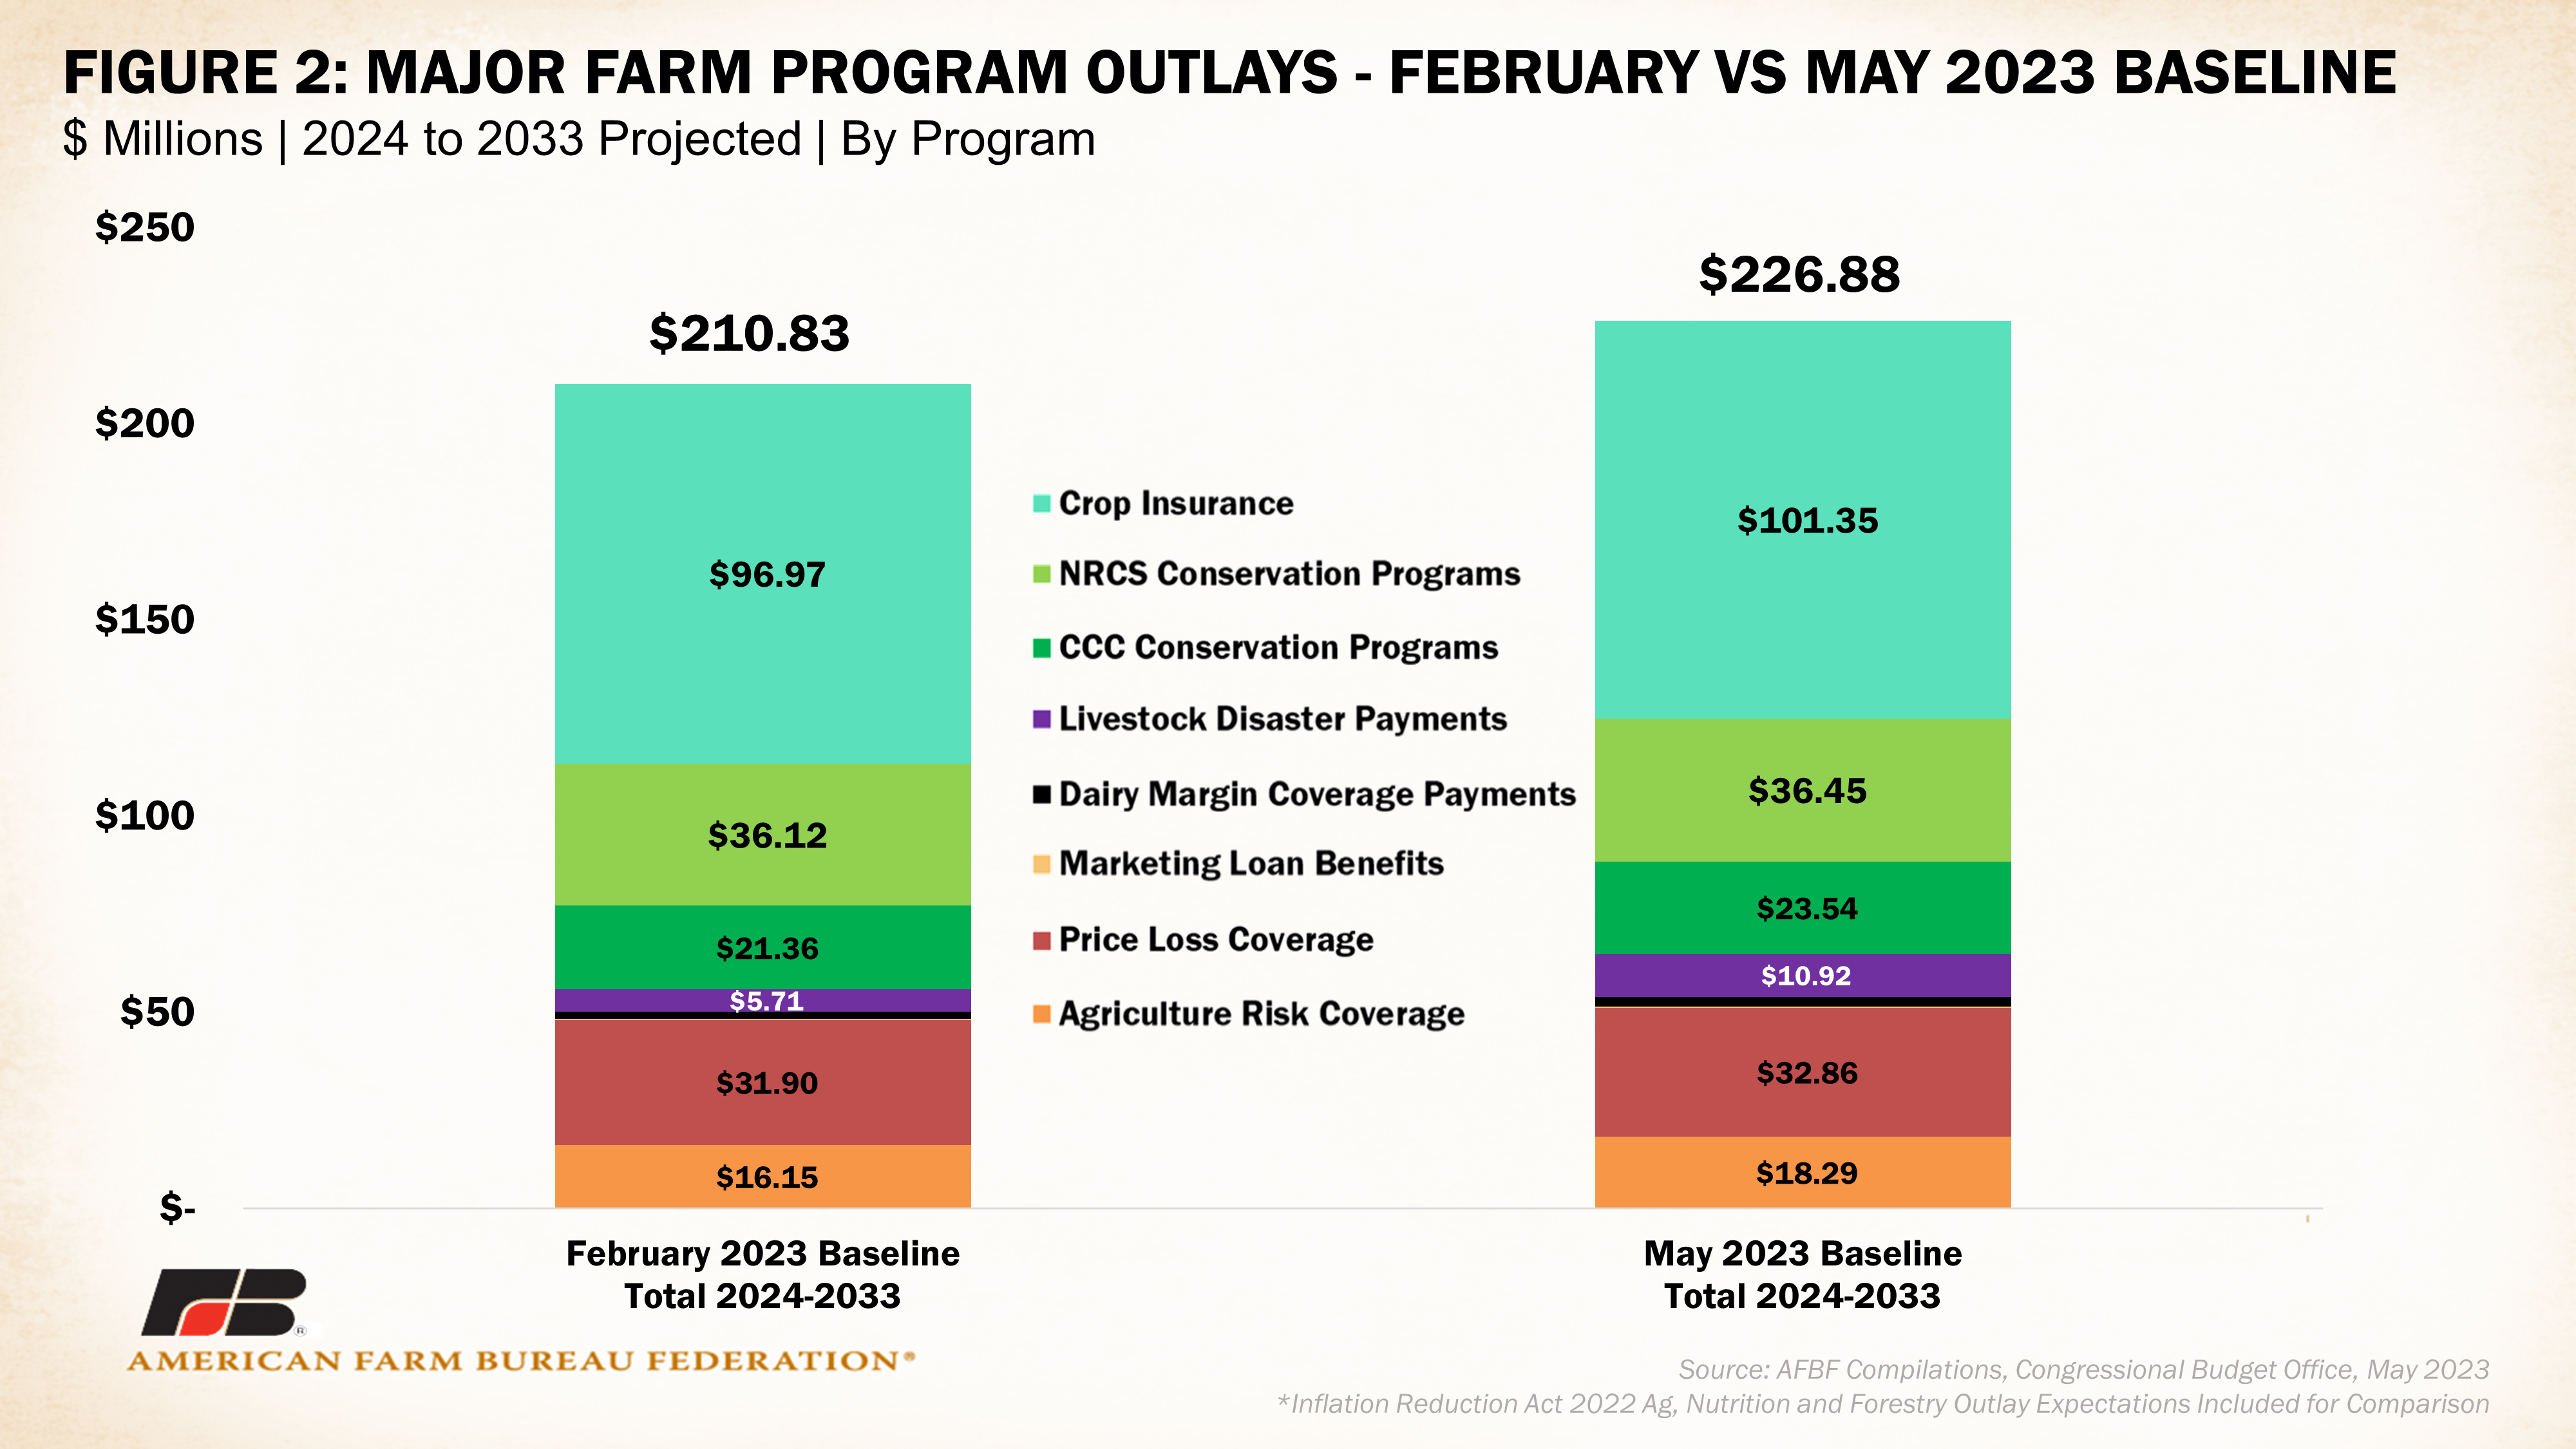
Based on the 2024-2033 10-year outlay projection, a 2023 farm bill would cost nearly $1.5 trillion, making it the most expensive on record. This is 1.73 times higher than the original estimated cost of the 2018 farm bill ($867 billion). After nutrition, crop insurance outlays, which include delivery expenses, underwriting gains and premium cost sharing, make up the second largest outlay category, projected at $101 billion or 7% of the 2024-2033 timeframe. This is a $4 billion increase from the February CBO baseline. The third-largest category includes spending on commodity support programs such as Dairy Margin Coverage (DMC), Price Loss Coverage (PLC), Agriculture Risk Coverage (ARC) and the many authorized disaster support programs. The May report expects these commodity programs to cost $65.7 billion between 2024-2033, up almost $10 billion from the February baseline. Estimated outlays for livestock disaster assistance programs alone almost doubled from $5.7 billion to $10.9 billion. Conservation programs such as the Environmental Quality Incentives Program (EQIP) and the Conservation Reserve Program (CRP) are estimated at $60 billion, or 4%, of the total score. This $2.5-billion increase from February’s projections is primarily linked to CRP outlays.
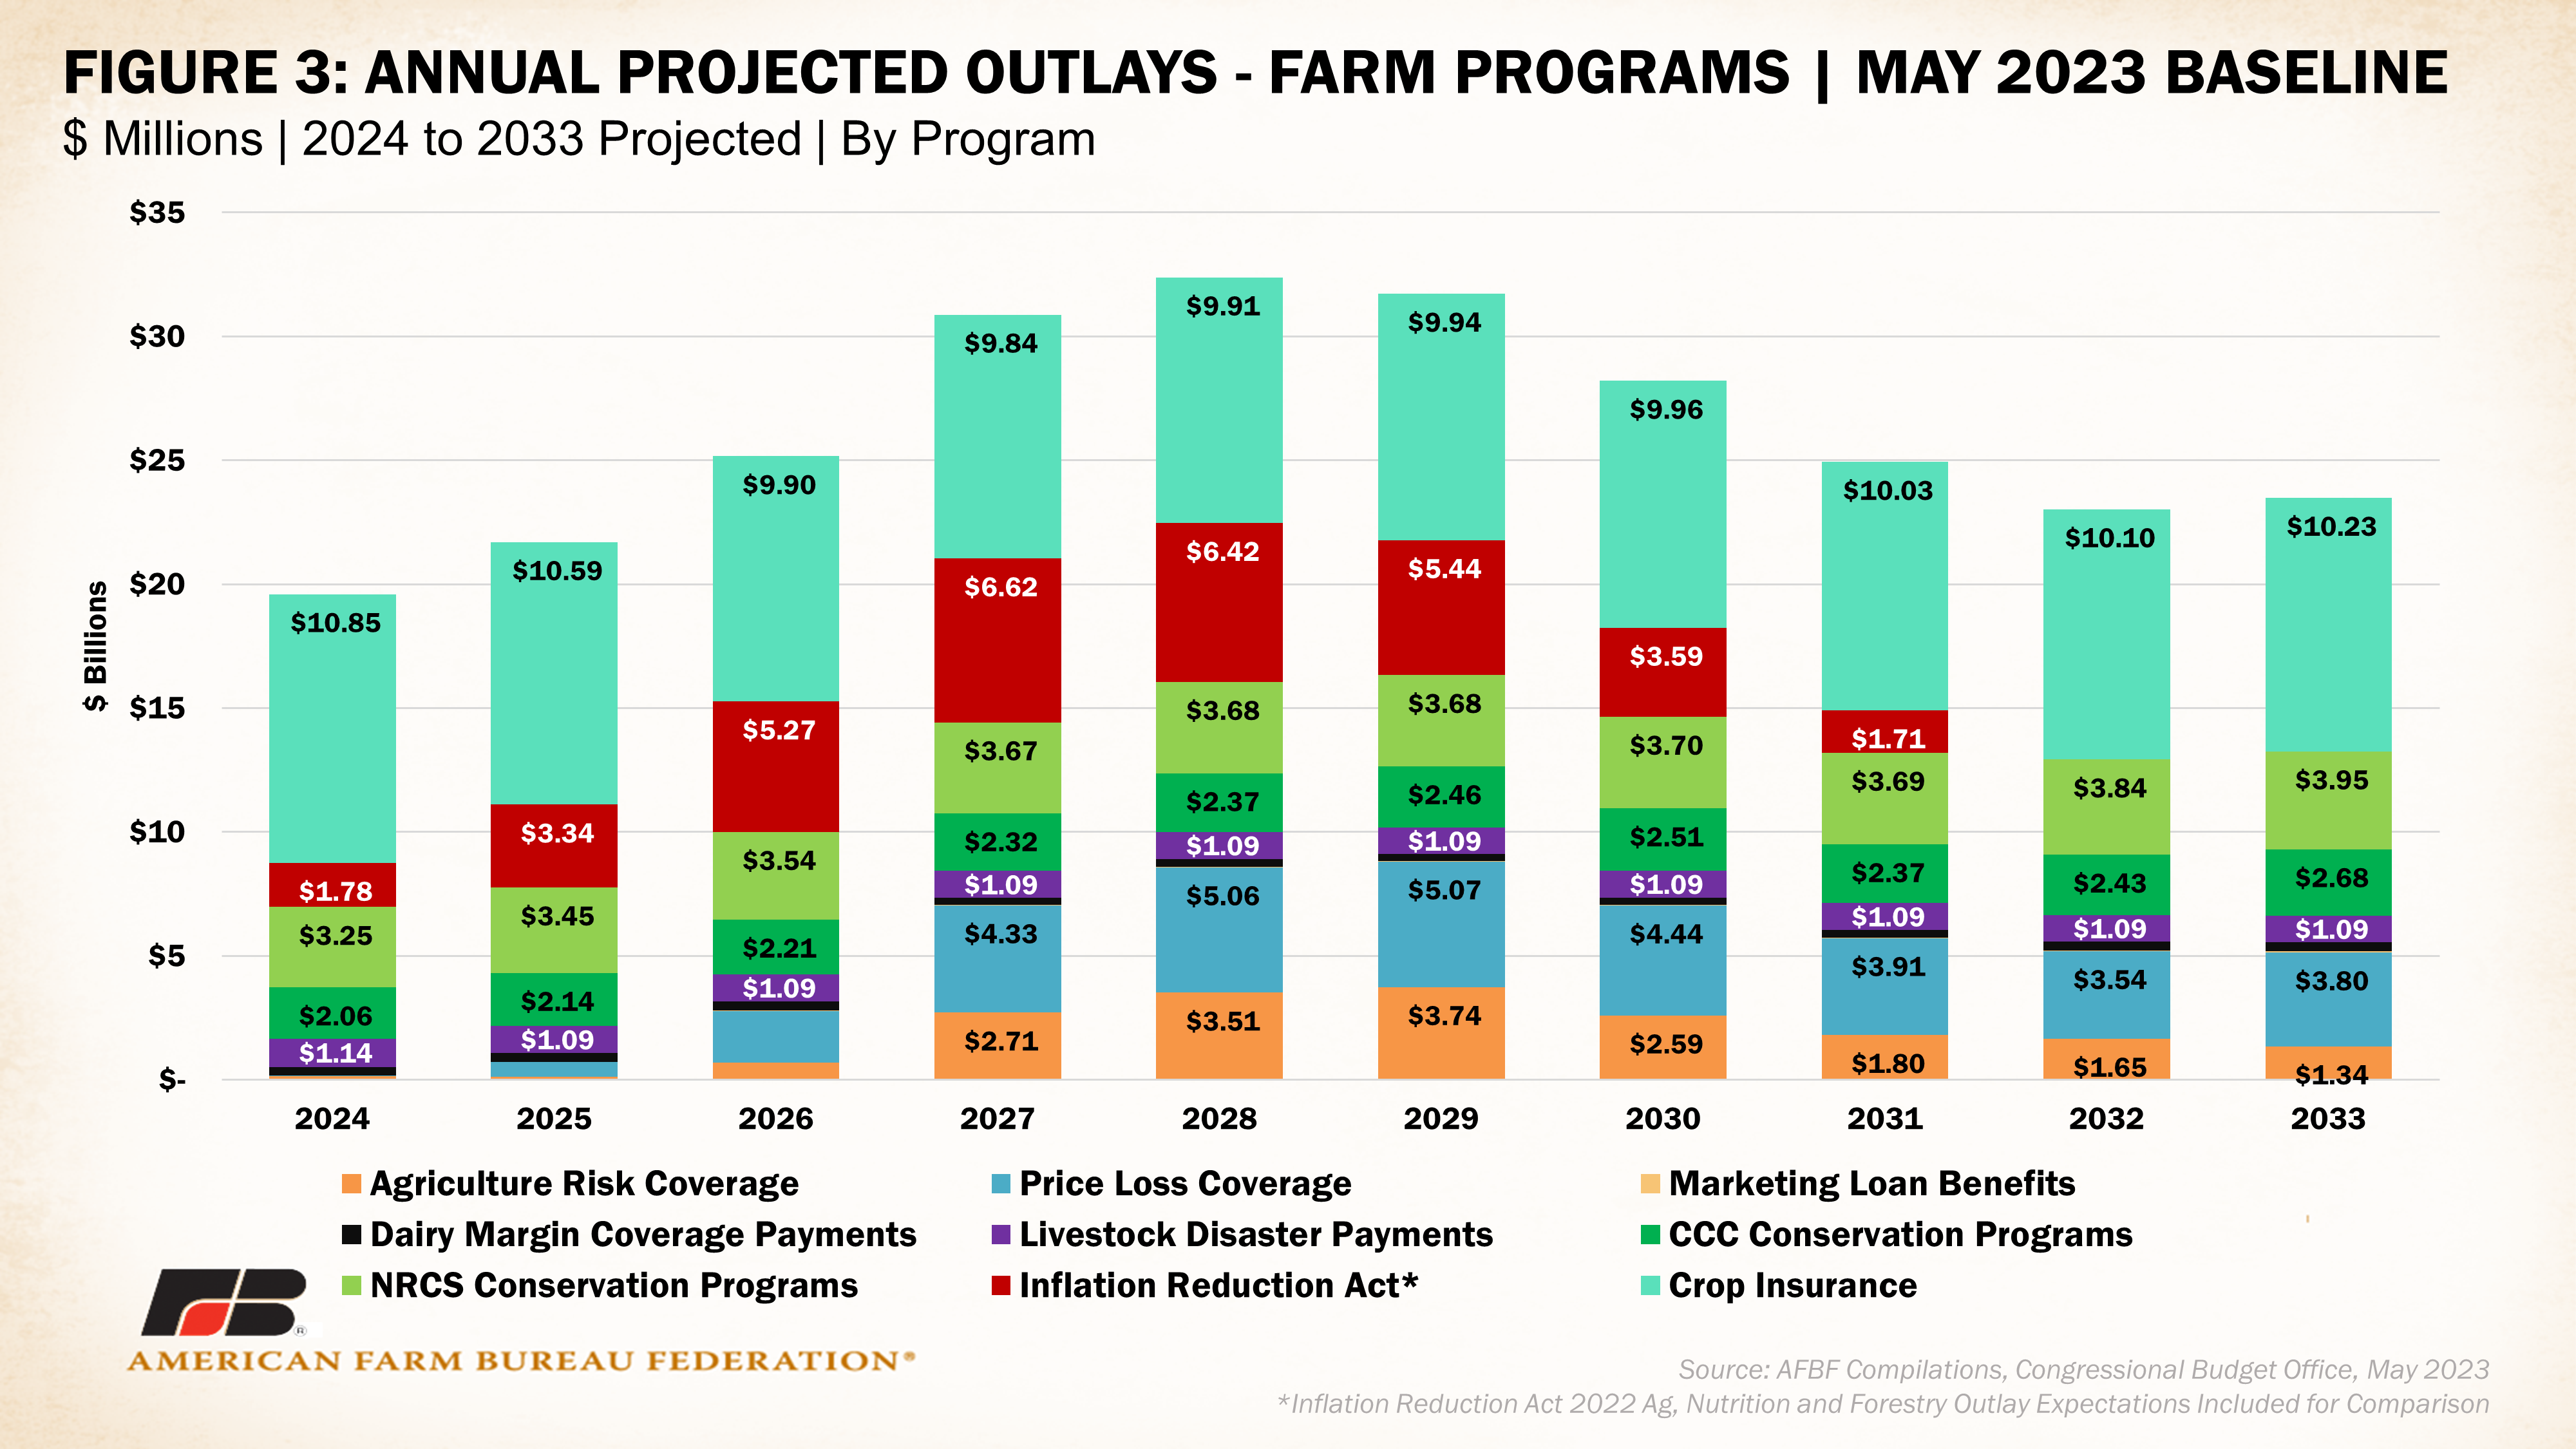
Figure 1 also includes $34.7 billion in spending that was passed in the Inflation Reduction Act for agriculture, forestry and rural development. CBO scored the IRA conservation baseline at $18.05 billion for programs traditionally authorized through the farm bill. Questions persist on how this IRA funding could impact farm bill program spending, prompting its tentative inclusion in our analysis below. There was no update to IRA spending expectations included in the May projections.
Overall, 2024-2033 expected outlays are up nearly $30 billion from the February projections – a 2% increase.

Cost of Farm Programs Higher for Some Commodities
Costs for many of the provisions of current farm programs move in the opposite direction of commodity prices. Recent periods of higher prices have resulted in lower commodity support payments. The distribution of farm program payments follows base acreage in the U.S. Corn, soybeans and wheat represent nearly 70% of all program payments, while rice, cotton and peanuts represent another 20%. Sorghum, upland cotton, dairy and other smaller field crops represent the remaining 10% or so of outlays, as shown in Figure 4. These outlays come in the form of PLC or ARC payments, and the margin protection program for dairy outlays through DMC. Compared to the February baseline, all analyzed crops except peanuts saw a forecasted increase in outlays. The increase was the highest for upland cotton, which moved from an expected $3.616 billion for 2024-2033 in February to $5.376 billion in May, mainly linked to increases in the PLC category.
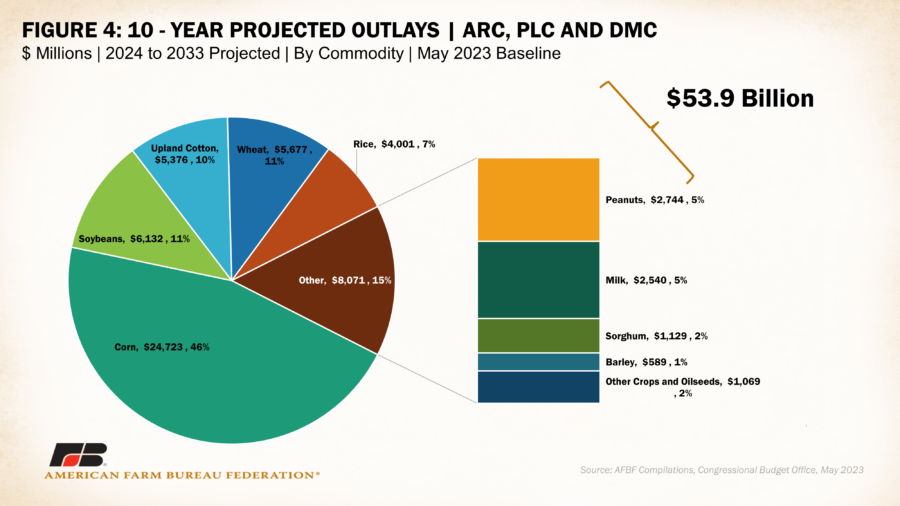
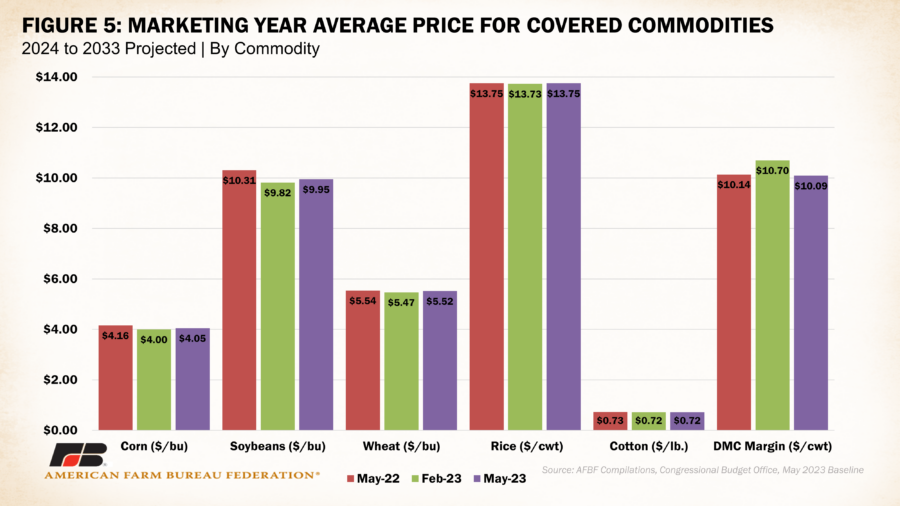
Figure 5 displays the CBO-projected average market price for a number of major crops as well as the DMC margin for milk. Most commodities have experienced very minor price adjustments. Traditionally, lower prices for commodities increase the cost of support programs. For example, the expected 2024-2033 average milk margin dropped from a projected $10.70/cwt in February’s baseline to $10.09/cwt in May’s, resulting in an expected outlay increase from $2.338 billion to $3.253 billion under DMC (excluding premiums paid).
Conclusions
This most recent CBO baseline on farm program outlays is an important indicator of the budget outlook and is expected to set spending boundaries during current farm bill debates. From a political standpoint, the expected increase in outlays, primarily linked to higher forecasted nutrition costs, can reduce the arguable space for expanding funding for new or existing programs. Higher payouts under existing commodity programs further constrict this budgetary “wiggle-room.” Notably, however, agriculture and nutrition programs normally authorized through the farm bill only make up about 1.85% of total federal spending. Drilled down further, farm income support and crop insurance account for less than one quarter of one percent (0.1% and 0.13%, respectively) of federal spending. Whereas Medicare, Medicaid, net interest on debt, defense spending and Social Security make up 76% of federal spending.
Like consumers purchasing food at the grocery store, farmers and ranchers face macroeconomic pressures when they purchase inputs and services. Few pieces of legislation are more significant than the farm bill when it comes to safeguarding our domestic food supply. Ensuring that program funding is reflective of market changes is critical to maintaining the farm bill’s role in national security and the health and well-being of rural communities.


