

To view the latest Oklahoma drought map, CLICK HERE.
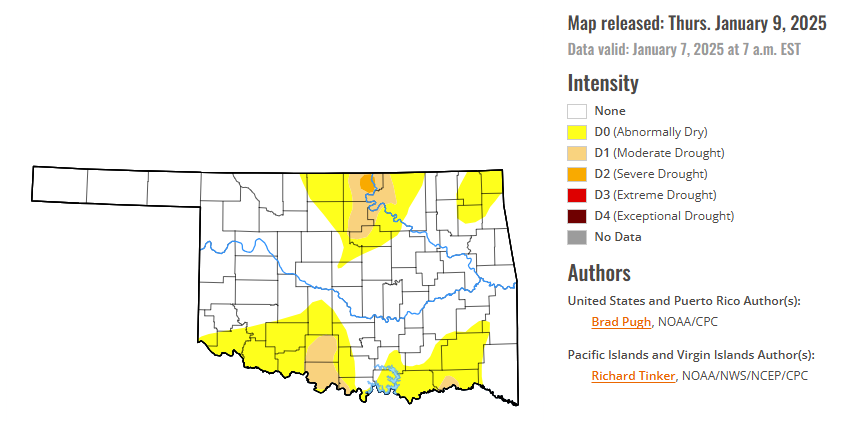
According to the latest Oklahoma drought monitor report, exceptional drought remains at zero percent, unchanged from the start of the calendar year.
Extreme drought or worse conditions remain at zero percent, unchanged since the week of October 29.
Severe drought or worse conditions are unchanged at 0.33 percent.
Moderate drought or worse conditions are unchanged at 5.52 percent.
Abnormally dry or worse conditions are unchanged at 29.72 percent.
According to the 6-to-10-day precipitation outlook map, the western half of Oklahoma is leaning above a 33-40% chance of precipitation through January 18, 2025. The eastern half of the state has near-normal chances of precipitation through January 18th.
To view the United States Drought Map, CLICK HERE.
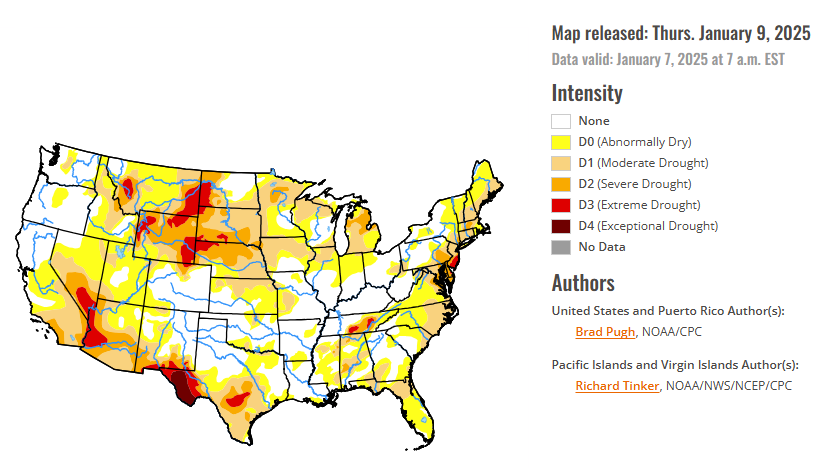
On January 4 and 5, a low-pressure system developed across the Central Great Plains and then tracked eastward to the Mid-Atlantic. Along its track, widespread precipitation (1 to 2 inches, liquid equivalent) was observed throughout eastern Kansas, Missouri, the Ohio and Tennessee Valleys, Central Appalachians, and Mid-Atlantic. Total snowfall amounts were near or more than a foot in portions of these areas. This winter storm also resulted in freezing rain for the Ohio Valley and parts of Virginia and West Virginia. Drought improvements were generally made to portions of the central and eastern U.S. where precipitation amounts exceeded 1 or 1.5 inches, liquid equivalent. Drought coverage and intensity continued its decline for the Upper Ohio Valley and New England. After the winter storm exited the East Coast, an arctic air outbreak overspread the eastern two-thirds of the lower 48 states. A favorable start to the wet season coupled with above-normal snowpack supported a decrease in drought coverage across the Pacific Northwest. Conversely, drought worsened for southern California and the Southwest. Alaska and Puerto Rico remained drought-free, while short-term drought intensified across Hawaii.
In the Southern Plains, based on 30 to 120-day SPI, 28-day streamflow, and soil moisture, a 1-category degradation was made to portions of the Edwards Plateau of Texas. SPIs at various time scales and soil moisture supported a 1-category degradation as well for parts of the Rio Grande Valley. Heavy rainfall during late December supported additional improvements across southeastern Texas. Recent rainfall (1 to 2 inches) prompted a 1-category improvement to parts of Mississippi and Tennessee. Despite the recent rainfall, 28-day average streamflow and 90-day SPI support a continuation of D1-D3 intensity for the Tennessee Valley. Although precipitation was lighter this past week, the lack of any support among the indicators for D0 and D1 led to improvements to much of Arkansas.
In The High Plains, based on 30 to 60-day SPI along with a lack of early season snowpack, a 1-category degradation was made to southwestern Colorado. Farther to the north across northwestern Colorado, improving snowpack resulted in a minor reduction in abnormal dryness (D0). Southwestern Nebraska has received little to no precipitation during the past 7 weeks, prompting an expansion of D0. In addition, above-normal temperatures during the late fall and into the early winter exacerbated increasing short-term dryness. Heavy precipitation (more than 1 inch, liquid equivalent) for this time of year resulted in a 1-category improvement to northeastern Kansas. No changes were made to the Dakotas and early January is one of the driest times of the year.
In the West, a dry start to the winter and using 90-day SPI and soil moisture, moderate drought (D1) was expanded across southern California. The NDMC short-term blend, 90-day SPI, and many 28-day average streamflows below the 10th percentile supported the addition of severe drought (D2) to portions of southern California. The Santa Ana winds during early January are likely to exacerbate the worsening drought conditions. Consistent with the NDMC short-term blend along with 30 to 120-day SPI, D2 was expanded for portions of southeastern Arizona and southwestern New Mexico. Based on water year to date (WYTD: October 1, 2024 to January 6, 2025) precipitation averaging above normal and snow water equivalent (SWE) above the 80th percentile, a 1-category improvement was made to southwestern Idaho, eastern to central Oregon, eastern Washington and a small part of northwestern Montana. This 1-category improvement is also supported by NDMC drought blends and SPIs at various time scales. As of January 7, SWE was above-normal (period of record: 1991-2020) across the southern Cascades along with eastern Oregon and southwestern Idaho. SWE was highly variable for the Sierra Nevada Mountains and below-normal across the Four Corners Region.
Looking ahead, A low pressure system is forecast to develop along the western Gulf Coast by January 10 with a rapid eastward track offshore of the Mid-Atlantic one day later. A large area of 1 to 2.5 inches of rainfall is expected for eastern Texas and the Lower Mississippi Valley, while accumulating snow occurs from the southern Plains east to the Tennessee Valley and Southern Appalachians. High elevation snow is forecast to shift east from the Cascades to the northern Rockies on January 10 and 11. Farther south across California, dry weather is likely to persist through mid-January. On January 13, another Arctic high is forecast to shift south from Canada to the Great Plains.
The Climate Prediction Center’s 6-10 day outlook (valid January 14-18, 2025) favors below-normal temperatures for a majority of the lower 48 states. The largest below-normal temperature probabilities (exceeding 80 percent) are forecast for the Southeast. An increased chance of above-normal temperatures is limited to the Dakotas and Minnesota. Below-normal precipitation is most likely across the Pacific Northwest, Great Basin, and much of California. Elevated above-normal precipitation probabilities are forecast for the Southwest, Texas, and High Plains, while below-normal precipitation is slightly favored along the East Coast.
To view the 6-10 Day Precipitation Outlook Map, click here.
To view the 6-10 Day Temperature Outlook Map, click here.
To view the Monthly Drought Outlook Map, click here.


