

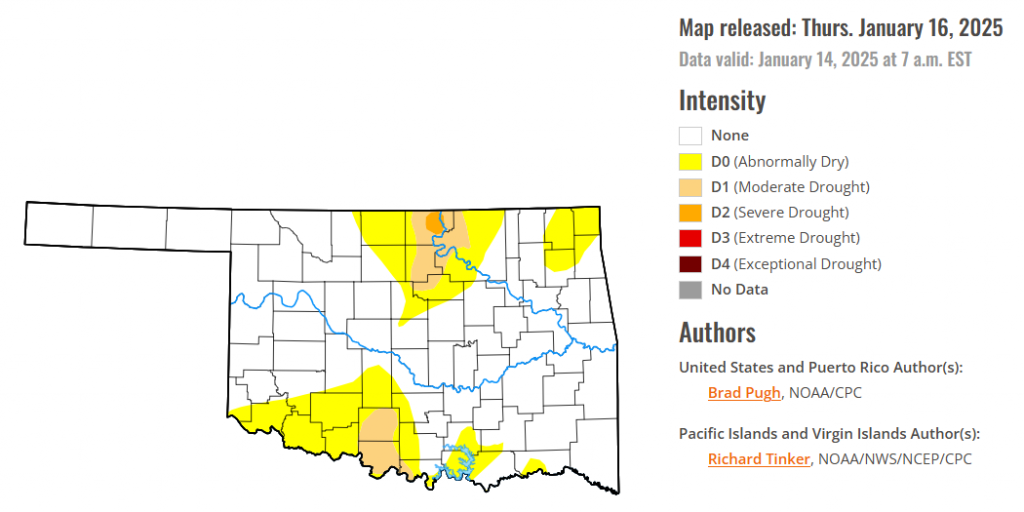
To view the latest Oklahoma drought map, CLICK HERE.
According to the latest Oklahoma drought monitor report, exceptional drought remains at zero percent, unchanged from the start of the calendar year.
Extreme drought or worse conditions remain at zero percent, unchanged since the week of October 29, 2024.
Severe drought or worse conditions are unchanged at 0.33 percent, since January 2.
Moderate drought or worse conditions have decreased to 5.25 percent, down from 5.52 percent last week.
Abnormally dry or worse conditions have decreased to 24.88 percent, down from 29.72 percent last week.
According to the 6-to-10-day precipitation outlook map, most of the state of Oklahoma is leaning below a 33-40% chance of precipitation through January 25, 2025. The northern corridor on the eastern half of the state is leaning below a 40-50% chance of precipitation, and a southern corridor on the eastern half of the state is near normal chances of precipitation through that January 25 date.
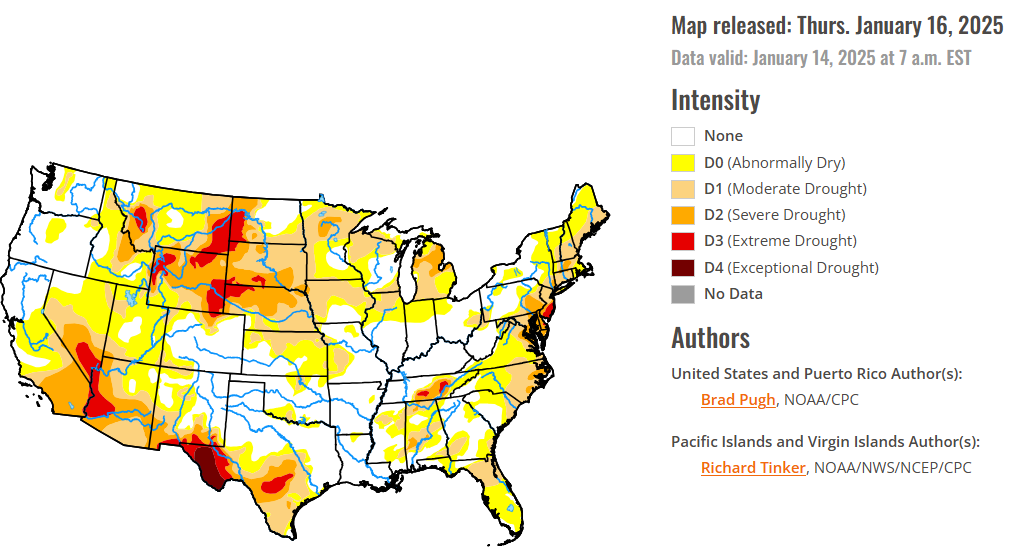
To view the United States Drought Map, CLICK HERE.
On January 9 and 10, a low-pressure system tracked along the Gulf Coast and resulted in widespread precipitation (1 to 2.5 inches, liquid equivalent) from eastern Texas and the Lower Mississippi Valley east to the Florida Panhandle. On the northern extent of this storm, snow blanketed areas from Oklahoma and Arkansas to north Georgia. This precipitation during the second week of January supported drought improvement. However, drought expanded and intensified for the Florida Peninsula, eastern North Carolina, west-central Texas, and the Southwest. During the first two weeks of January, multiple Arctic surface highs shifted south from Canada and temperatures (January 1-13) averaged 4 to 8 degrees F below normal for much of the Great Plains, Middle to Lower Mississippi Valley, and Southeast. A very dry start to the wet season continued to affect southern California with worsening drought conditions, periodic Santa Ana winds, and large wildfires. Enhanced trade winds, typical during a La Niña winter, resulted in improving drought for the windward side of the Hawaiian Islands.
In the Southern Plains, more than 1 to 1.5 inches of precipitation (liquid equivalent) supported improvements for portions of eastern Texas, Arkansas, Louisiana, and Mississippi. The small areas of severe drought (D2) were discontinued in northeastern Mississippi due to: 28-day average streamflows near the 20th percentile, soil moisture recovery, and a consensus of SPIs in D1 at worst. In addition, there is no support for maintaining D2 in the NDMC short- and long-term blends. Precipitation during the first two weeks of January resulted in a slight reduction in extreme drought (D3) across south-central Tennessee. For central Texas which received generous precipitation for this time of year, low 28-day streamflows (below the 20th percentile in D1 and 10th percentile in D2) precluded a larger area for a 1-category improvement. D2 to D3 drought was expanded across the Edwards Plateau of Texas due to 28-day average streamflows below the 10th and 5th percentile, respectively.
In The High Plains, the central area continued to have worsening drought conditions and moderate drought (D1) was expanded across portions of southwestern Nebraska using 60-day SPI, soil moisture below the 10th percentile, and the NDMC short-term blend. Although light precipitation (less than 0.5 inch, liquid equivalent) fell across parts of south-central to southeastern Kansas, this precipitation was too low to justify any improvements. Elsewhere, across the Central to Northern Great Plains, no changes were made as early to mid-January is a dry time of year. D1 was expanded across southwestern Colorado due to low snow water equivalent and 60-day SPI.
In the West, severe drought (D2) was expanded to include all of southern California due to the very dry start to the water year to date (WYTD) from October 1, 2024 to January 13, 2025. The D2 coverage coincides with where WYTD precipitation has averaged less than 5 percent of normal. A number of locations, including San Diego, are having their driest start to the water year. The D2 covers Los Angeles and Ventura counties which are being affected by periodic Santa Ana winds drying out vegetation and large wildfires. Following the two wet winters, the large reservoirs throughout California are at or above-normal. Based on 90-day SPI, declining soil moisture, and low snow water equivalent, a 1-category degradation was warranted for parts of Arizona and southwestern Utah. A mix of improvements and degradations were made to Idaho and the depiction is generally consistent with the 2024-2025 WYTD precipitation and snowpack. Eastern Washington and much of Oregon are drought-free, but low snowpack supports moderate drought (D1) along the northern Cascades of Washington. A 1-category improvement was justified for a portion of central Montana, based on 90-day SPEI along with snow water equivalent (SWE) above the 75th percentile. As of January 14, SWE was above-normal (period of record: 1991-2020) across the southern Cascades along with eastern Oregon and southwestern Idaho. SWE varies for the Sierra Nevada Mountains, those numbers are beginning to decrease after a drier-than-normal start to January. SWE remained well below-normal across the Four Corners Region.
Looking ahead, Another Arctic air outbreak is forecast for the central and eastern U.S. during mid-January as surface high pressure shifts south from Canada. By January 20, subzero minimum temperatures are expected as far south as the Central Great Plains, Middle Mississippi Valley, and Ohio Valley. During January 16-20, little to no precipitation is forecast from the West Coast to the Mississippi Valley with light to moderate precipitation amounts (0.5 to 1 inch) limited to the Southeast. These amounts, however, have been sufficient for rainfall to almost keep up with demand, and the near-normal amounts the past 2 weeks have kept the area out of D0 conditions for the time being, but the situation needs to be closely monitored for signs of increasing dryness impacts. Daily rainfall reports are not available for Mili since the start of January 2025, but 45.59” fell during October-December 2024, above the normal of 36.55” and well above the amount needed to keep up with demand, which is sufficient to keep D0 conditions at bay regardless the rainfall during the past 2 weeks.
The Climate Prediction Center’s 6-10 day outlook (valid January 21-25, 2025) favors below-normal temperatures to persist for much of the contiguous U.S. with the largest below-normal temperature probabilities (exceeding 80 percent) extending from the Mid-Atlantic and Ohio Valley south to the Gulf Coast. Elevated above-normal precipitation probabilities are forecast for the northern Great Plains, Gulf Coast, and portions of the Southeast. Below-normal precipitation is favored for the West, Central Great Plains, Midwest, and New England.
To view the 6-10 Day Precipitation Outlook Map, click here.
To view the 6-10 Day Temperature Outlook Map, click here.
To view the Monthly Drought Outlook Map, click here


