To view the latest Oklahoma drought map, CLICK HERE.
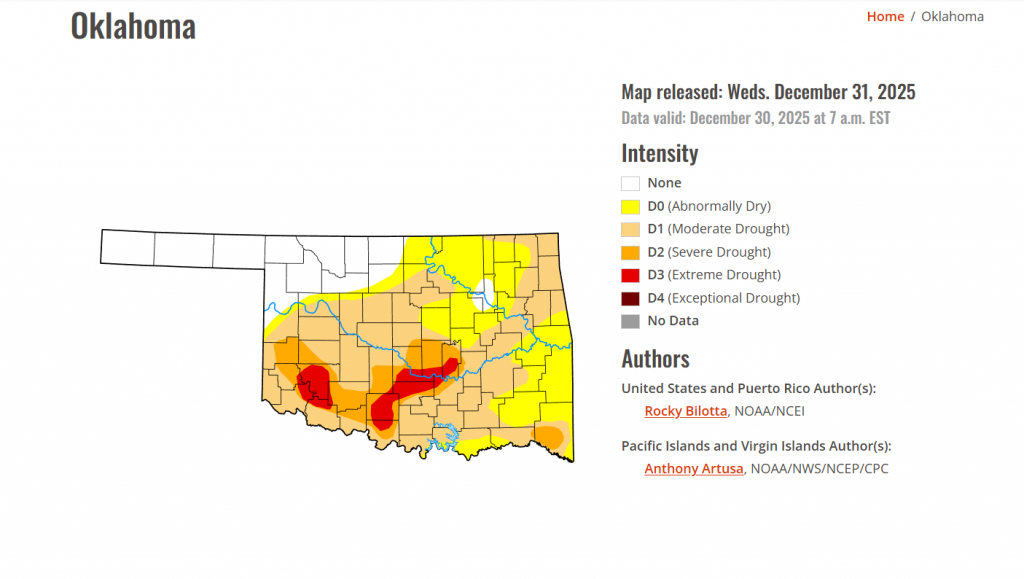
The latest Oklahoma Drought Monitor shows drought conditions worsening across the state, with moderate to extreme drought now covering nearly 54% of Oklahoma—up sharply from about 45% last week—while exceptional drought remains at zero percent. Extreme drought continues to hold steady in southern Oklahoma at 4.8%, even as recent heat and dryness have intensified impacts. Looking ahead, short-term outlooks offer some optimism, with central and eastern Oklahoma leaning toward a 50–60% chance of precipitation through January 10.
According to the latest Oklahoma Drought Monitor report, exceptional drought remains at 0 percent, unchanged from the start of the calendar year.
Moderate drought to extreme drought conditions in the current period indicate that 53.74 % of the state is affected by drought. Compared with last week’s 44.79%, drought conditions have worsened in the state this week.
Extreme Drought has remained unchanged this week. No new extreme drought has emerged, but the conditions still remain in southern Oklahoma, covering 4.80% of the state, the same as the previous week.
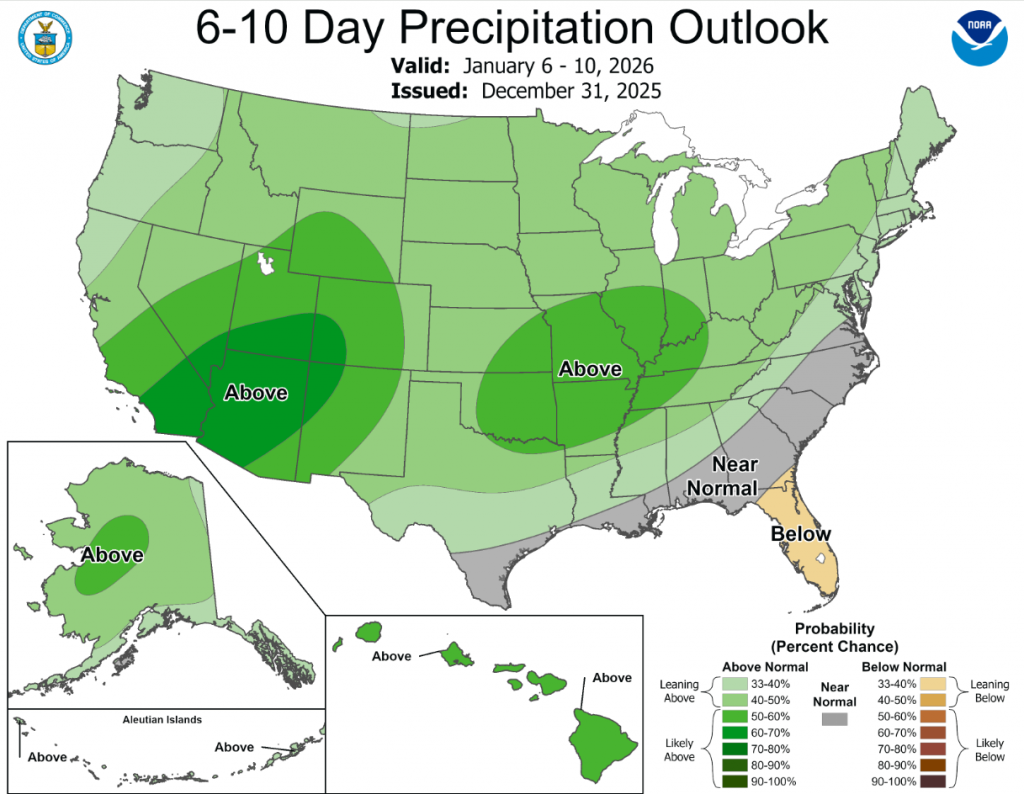
According to the 6-to-10-day precipitation outlook map, central and eastern Oklahoma are leaning above 50-60% chance of rain while western Oklahoma is leaning above 40-50% chance of rain through January 10th.
This week, a massive heat dome settled over the central and southern United States, creating unprecedented warmth for the holiday week. This high-pressure system shattered daily high-temperature records, with readings soaring 15 to 35 degrees above average across the region. Numerous daily records were broken between December 24 and December 27, contributing to what was forecast to be the warmest Christmas Day on record for the contiguous U.S. The weather pattern snapped violently late in the weekend as a powerful winter cyclone swept eastward from the Plains between December 27 and 29. This system drove a sharp cold front through the South, causing temperatures to plummet from record highs to near freezing overnight. Simultaneously, the storm unleashed severe winter conditions across the Upper Midwest and Great Lakes, delivering blizzard conditions and up to two feet of snow near Lake Superior, alongside significant ice accumulations that snarled travel in parts of the Northeast. Precipitation was near- to below-normal for much of the country, while much of the West, and parts of the Midwest and Northeast observed above-normal precipitation during this week. The West Coast was a notable exception where a strong atmospheric river brought heavy precipitation to most of California, dumping over 10 inches of rain in some areas and several feet of new snow in the mountains.
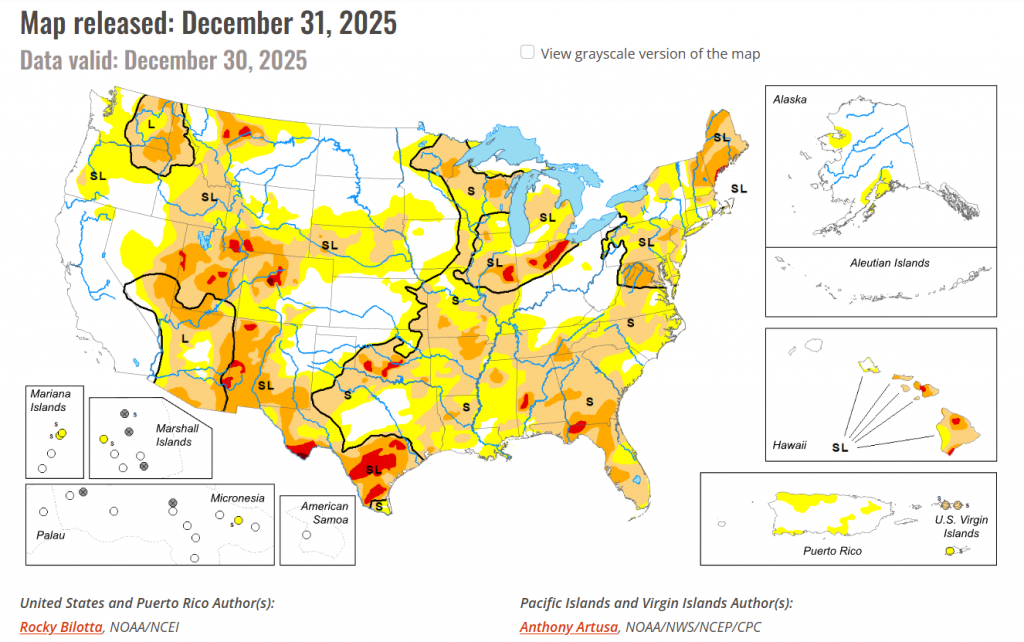
In the Southern Plains: Below-normal precipitation and above-normal temperatures dominated the South this week, resulting in widespread drought degradation across the region. Temperatures were above normal for the entire region, with departures ranging from +5 degrees F to +25 degrees F. Dry conditions also persisted, with monthly rainfall totals ranging from 1 to 5 inches below normal (5% to 25% of normal) for December. Extreme drought (D3) expanded in central Texas, while severe drought (D2) was introduced or expanded in southeast Oklahoma, southeast Texas, west-central Louisiana, eastern Tennessee, parts of central Texas, and northeast Arkansas. Moderate drought (D1) and abnormal dryness (D0) expanded across much of the region.
In the High Plains: Warmer-than-average temperatures dominated the High Plains this week, with departures ranging up to +25 degrees F above normal, while near- to below-normal temperatures were observed along northern portions of the region. Precipitation varied across the region, with most areas reporting near- to below-normal totals. Western Wyoming was the exception, where weekly precipitation totals were 200% to 600% of normal. Consequently, severe drought (D2) was removed from western Wyoming, while moderate drought (D1) and abnormal dryness (D0) improved. Conditions were drier on the east side of the state, justifying the expansion of abnormal dryness in those areas. The majority of the southern half of the High Plains observed temperatures 10 to 20 degrees above normal for the week, while precipitation totals were reported to be 25% or less of normal. Extreme drought (D3) expanded in central Colorado, while moderate drought (D1) expanded in southern Colorado, across northern portions of Nebraska, and in southeast Kansas. Abnormal dryness (D0) expanded across northeast Colorado, southern and northern portions of Nebraska, and in southeast Kansas.
In the West: Temperatures were above normal across much of the West this week, while below-normal temperatures were observed along parts of the West Coast and in northern Montana. For the week, temperature departures ranged from -10 degrees F below normal in northern Montana to +25 degrees F above normal in parts of Nevada and Utah. Precipitation varied across the region, with beneficial amounts falling across much of the southwest and parts of the north. Over the past 14 days, much of the West has received 2 to 20+ inches of precipitation, with departures ranging from +1 to +8 inches above normal (150% to 800% of normal). This above-normal precipitation justified the removal of extreme drought (D3) from the Washington-Idaho-Oregon border and reduced severe drought (D2) coverage in northern Montana. Moderate to severe drought (D1-D2) conditions improved in portions of Washington, Idaho, Montana, Nevada, and southern Arizona, while moderate drought (D1) was removed in western Washington and improved in north-central Oregon and central Arizona. Abnormal dryness (D0) was removed from southern California and improved across northern portions of the region. Conversely, conditions were drier than normal across interior and eastern portions of the region. Lack of precipitation and growing deficits resulted in the expansion of severe drought (D2) in western Utah, while moderate drought (D1) and abnormal dryness (D0) expanded in central Nevada this week.
To view the 6-10 Day Precipitation Outlook Map, click here.
To view the 6-10 Day Temperature Outlook Map, click here.
To view the Monthly Drought Outlook Map, click here.