
Geopolitical and weather factors turned the agricultural markets slightly bearish over the last week. The on again-off again Iran conflict is tilting toward a compromise while rains in the southern half of the U.S. provided much-needed
relief.
Wheat Market Outlook:
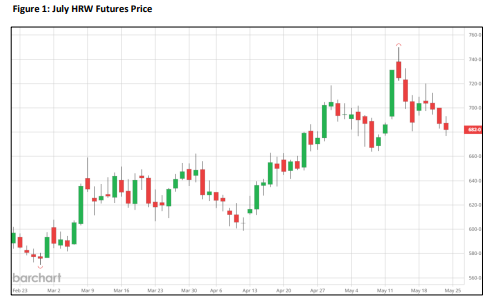
HRW futures markets dropped over the last week after touching $7.50 after the release of the May Crop Production report. As shown in Figure 1, KC July hard red winter wheat prices closed last Friday at $6.82. Major shifts in expectations regarding the Iran conflict along with supportive weather created a bearish sentiment. July delivery basis sits at -45 to -55 across the state with various locations sitting at 35 under. Despite the recent retreat in prices, expect a
continuation of volatility through harvest. Demand remains on pace with current USDA forecasts for the marketing year. Conditions continue to impact winter wheat production and speculation around the USDA May forecast for winter
wheat production will stay in focus. If the crop is larger, the difference seems unlikely to be exceptionally large.
commitments at 921 million bushels. The total place all wheat exports at 102 percent of USDA’s forecast. Over the last five years, the average at this point in the marketing year is 103 percent. Cancellations and shifting exports into the next marketing year account for the greater than 100 percent total. Outstanding sales for next marketing year sit at 75 million bushels, down from 123 million bushels at this point last year. Wheat exports stay on track to hit USDA’s forecast. HRW exports converge on the USDA forecast as well. HRW total commitments sit at 324 million bushels with 31 million bushels of outstanding sales. The prospect of a much smaller HRW crop this year is showing up in next marketing year sales as U.S. prices moved higher. HRW outstanding sales for the next marketing year sit at 11.5 million bushels through May 14, down from 34.7 million bushels at this time last year.
Global competitors, at present, have concerns as well. Canada’s spring wheat crop in the Prairie provinces is going in slower than last year with Manitoba, Saskatchewan, and Alberta all reporting lower planting pace. The spring wheat crop is typically around 96 percent of Canadian wheat production. The EU wheat crop is forecast at 136 million metric tons by USDA, but recent analysis from MARS in the EU showed dryness in Poland and the Baltic states that may take tons out of the forecast. Even so, the consensus forecast is on par with production from two year ago after the large crop last year.
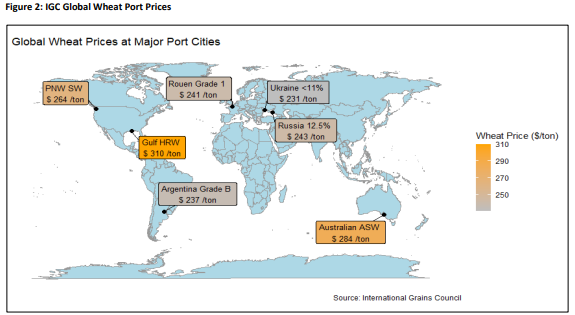
Exports out of the EU recently slowed with reports of large domestic wheat crops in North Africa and Turkey possible slowing imports in those regions this year. Turkey is a major importer and the possibility of an import ban on wheat impacts prices in the Black Sea region and the globe. Ukrainian wheat production remains on track to be around USDA’s 23 MMT forecast with exports ticking up out of the Black Sea region in general. Australia saw export prices rise as concerns about severe dryness in Western Australia and the potential for a major El Nino event on track to impact production in the region. Figure 2 shows major exporter wheat prices as of May 19. U.S. competitiveness remains
contingent on quality and price competitiveness. The dollar strengthened against competitor currencies over the last two weeks and uncertainty regarding the macroeconomic situation will keep the dollar in the spotlight.
Soybean Market Outlook:
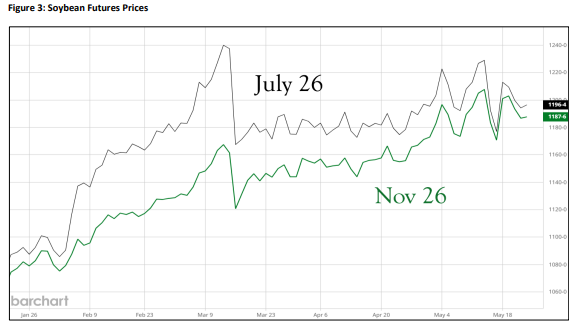
Soybean futures prices moved slightly down over the last week despite indications of continuing strong crush from NOPA. Export sales data for total commitments pace sit three percent, at 95 percent, below the 5-year average pace on USDA’s forecast as of May 14. Soybean planting sat at 67 percent on May 17, up from the 5-year average of 53 percent. Planting is ahead of the 5-year pace in each of the 18 states tracked in the Crop Progress report except for Michigan. The prospect of soybean acreage hitting or exceeding the Prospective Plantings report total seem high at this point. As seen in Figure 3, July futures climbed higher last Friday to close at $11.96. The November contract closed at $11.87 and continues a sideways pattern seen since the beginning of May. Cash prices in Oklahoma are around $10.91 – $11.06 with -90 to -105 basis. Harvest prices came in near $10.97 with basis at 90 under the November contract.
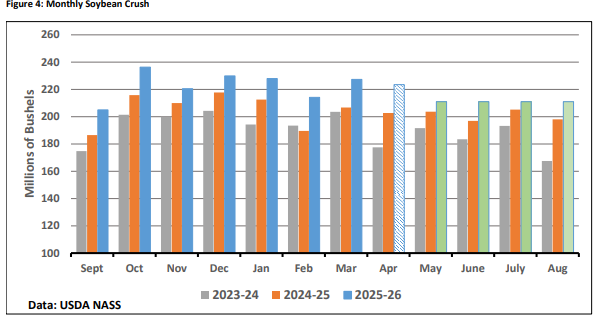
NOPA released soybean crush data for April last week. The data gives a reliable indication of crush totals USDA estimates for April that is reported on June 1. NOPA placed crush at 211.86 million bushels. Based on previous relationships, April crush may be 223.5 million bushels or in that range. As Figure 4 shows, estimated crush pace through April implies 211.3 million bushels a month is necessary from May through August to hit USDA’s 2.63-billion-bushel forecast. Thus far this marketing year, crush came in below 211 million bushels only once and that was in September at the start of the marketing year.
The potential to raise crush to higher levels relies on estimates of soybean meal demand. At present, soybean meal usage is at record levels for both domestic and export categories. Meal prices remain above $300 per short ton in futures markets with cash prices reported above futures in most areas of the U.S. The prices indicate meal demand can stay up to pace with expanded crush levels now. Demand for U.S. soybean meal can expand even higher than current record level projections. The prospect of slower economic growth due to the energy shock hangs over the rosy picture.
Soybean oil prices remain in the mid-70 cent area on bright prospects for biofuel usage. The EPA released data last week for April. Biodiesel production came in at 129.2 million gallons, up from 117.1 in March. Renewable diesel totaled 274 million gallons, up from 263.9 million. While higher production is supportive for soybean oil prices, production or imports of biodiesel/renewable diesel need to increase further still to hit the RFS requirements for 2026.
Soybean export sales data through May 14 place U.S. total commitments for soybeans at 1.447 billion bushels. Weekly new sales have fallen to average 7.8 million bushels per week over the last month. The massive Brazilian crop continues to provide stiff competition in the export market. U.S. Gulf soybean prices have been running around $30 per ton (82 cents a bushel) higher than port prices in Paranaguá. While China’s agreement to buy U.S. soybeans seems to be in effect, the timing of sales remains flexible and uncertain.