In his weekly newsletter, OSU Crop Marketing specialist Todd Hubbs writes: On Tuesday, USDA released reports that underpin U.S. market potential for spring crops leading into summer. The June Acreage and Grain Stocks reports capped a week of extreme weakness in crop futures markets as participants positioned themselves for the USDA data.
The USDA’s reports delivered support to the wheat and corn market. Lower wheat acreage and a June 1 corn stocks estimate that supported usage combined to provide positive news to markets. Soybean stocks and acreage came in neutral to slightly positive for soybean prices. This newsletter reviews the major takeaways and implications from those reports.
Acreage Report
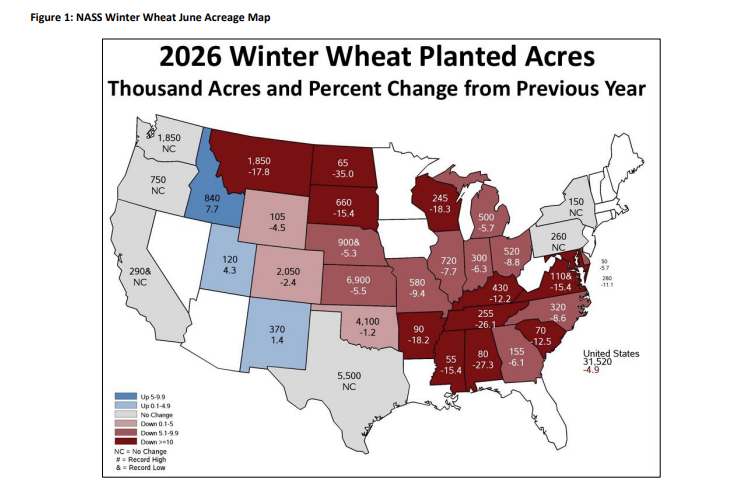
All wheat acreage is projected at 42.7 million acres for the 2026 crop year, down six percent from 2025. Lower acreage across the major classes is the consistent story from the prospective plantings report. Winter wheat acreage fell from the March Prospective Plantings report and is down around three percent from the previous estimate by NASS at 31.5 million acres. Figure 1 provides state-level winter wheat acreage with comparisons to last year.
Oklahoma dropped from 4.8 million to 4.1 million acres in this report. Kansas also fell 100 thousand to record 6.9 million acres. In total, NASS places hard red winter wheat acreage at 22.4, down from 23.1 million acres in the previous acreage report. Soft red winter acreage dropped from the March report to 5.54 million acres.
Spring wheat acreage came in six percent lower than 2025 in total acreage at 9.39 million acres. The Acreage report total is down slightly from March. All major spring wheat states came in lower on acreage except for Montana which remained unchanged. At 4.5 million acres, North Dakota reduced spring wheat acreage by 200 thousand more acres than estimated in March. In total, North Dakota spring wheat acres are down almost twelve percent from 2025. Montana spring wheat acreage came in at 2.35 million, up from 2.15 planted in 2025.
Oilseeds benefited from lower wheat and corn acres in the northern plains with canola, sunflower, and soybean area increasing across the region. Canola acreage came in at 2.965 million acres, up almost 27 percent from last year. In particular, North Dakota intends to plant 2.35 million acres, up from 1.81 million in 2025. Oklahoma upped canola acreage to 27 thousand acres in 2026. Lower winter wheat acreage was expected, but confirmation of the loss is supportive for wheat prices.
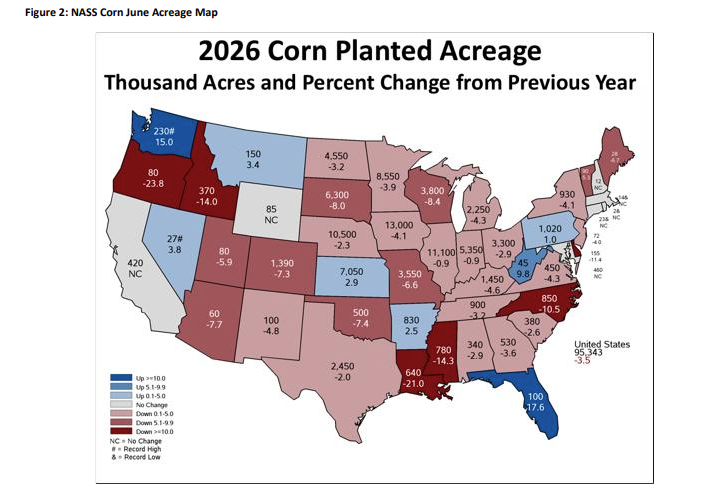
Corn acreage did not change from March with 95.34 million acres of corn expected this year. The reported corn acreage came in slightly above trade expectations of 94.9 million. Speculation on lower corn acreage was widespread due to concerns about input costs. While the final acreage total has yet to be settled on, corn acreage near this level seems assured at present. Recently, corn acreage in the June report has changed by the time NASS provides the final corn acreage. Final acreage last year jumped by a market crushing 3.58 million acres after the June report. One would like to believe that such a change is rare. Over the previous five years before last year, final corn acreage averaged 600 thousand acres below the June estimate. Final acreage decreased in 3 years and increased in the other two but overall, the changes were not excessive.
Acreage is down from last year across the Corn Belt as shown in Figure 2. Large acreage swings concentrated in the Plains with western Corn Belt states decreasing corn acreage at healthy percentages. Oklahoma dropped to 500 thousand acres, down 7.4 percent. Like after the March survey, the temptation to fade corn acreage will be discussed intensively until FSA data comes out with the August production report.
If corn planting totals 95.3 million acres, harvested grain acreage may be close to 87.4 million acres. A U.S. average yield near 183 bushels per acre leads to a 2026 production projection of 16 billion bushels. Production at that level would be down from 2025, but it would still constitute a burdensome supply given expected ending stocks.
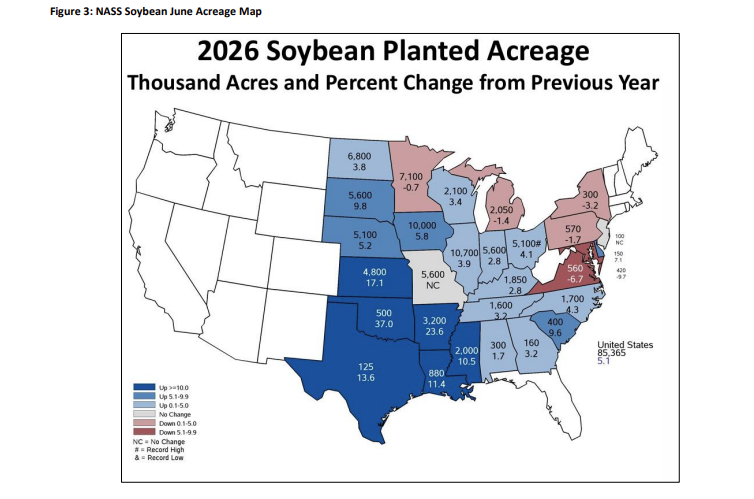
Soybean acreage totaled 85.36 million acres, up from the March expectations of 84.7 million acres of soybeans, as shown in Figure 3. The soybean acreage intentions came in near market expectations. Soybean acreage is up across the country. In major producing states, both Illinois and Iowa exceeded 10 million acres, with robust growth in the Plains. The Delta region saw large increases as well with Mississippi and Arkansas increasing acreage by 190 and 610 thousand acres respectively in 2026. Oklahoma intends to plant 500 thousand acres, up 135 thousand from last year. Interestingly, Oklahoma soybean acreage planted after another harvested crop shot up to 53 percent of the total.
In addition to the allocation of acreage to wheat, corn and soybeans, the magnitude of total principal crop acreage shows a 1.9 million acre decrease from 2025. The USDA estimates that acreage planted to principal crops totals 309.6 million acres and continue to show acreage losses year over year. Milo acreage is projected to be 5.4 percent lower than a year ago at 6.28 million acres. declined by 17.5 peanut acreage fell 425 thousand acres to 1.53 million. Harvested acreage of hay is expected to increase by 500,000 acres to 49.8 million acres.
The acreage report held few surprises unless one believed the major shift out of corn acres due to input costs. The potential for lower corn acres still exists, but any expected change should be minor in comparison with last year’s major acreage adjustment.
Grain Stocks Report
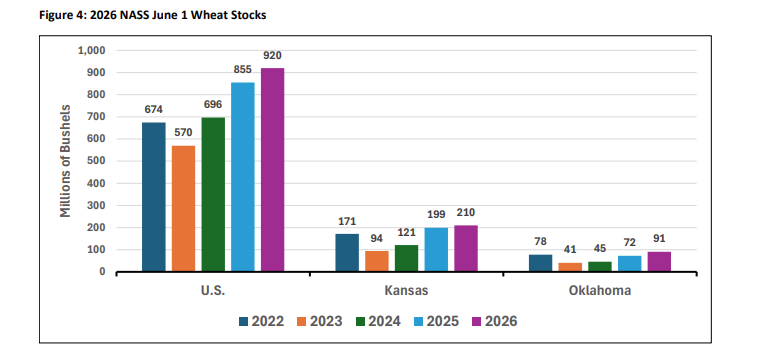
Wheat stocks, as shown in Figure 4, totaled 920 million bushels on June 1 to end the marketing year. The NASS survey on wheat stocks came in slightly below the average industry estimate. On farm wheat stocks of 177 million bushels were dominated by the 75.5 million bushels on farm in North Dakota. At the state level, Kansas and Oklahoma both saw higher stocks levels than this time last year. Stocks in the Southern Plains and North Dakota are up year over year. Disappearance for the final quarter of the old crop marketing year came in at approximately 383 million bushels, up slightly over the same period last year. Overall, the stocks report was slightly supportive for wheat.
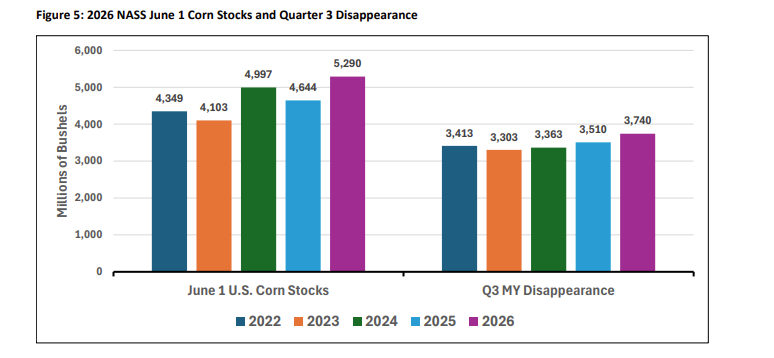
As shown in Figure 5, March 1 corn stocks came in at 5.29 billion bushels compared to an average trade guess of 5.4 billion bushels. The stocks estimate suggested feed and residual use of corn during the 2025-26 marketing year came remains on pace to hit USDA’s 6.2 billion bushel forecast for the marketing year. A bullish surprise in corn stocks is supportive for prices as the concern over a bearish stocks report will continue to see caution by traders around these report dates. March through May disappearance came in at 3.74 billion bushels and reflects to strong export and ethanol usage seen in weekly data.
The soybean stocks report appears neutral for soybean prices. The June 1 soybean stocks estimate was 1.06 billion bushels, slightly above trade expectations. The stocks estimate implied a disappearance of 1.06 billion bushels in the third quarter of the marketing year, up 18 percent from the same period last marketing year. Increased usage in the third quarter reflects the growth in crush capacity. The implications for soybean prices over the near term are small. Prices continue to reflect higher crush due to expansion in biofuel usage and trade issues.