

Beef demand is very complex. Although we frequently discuss beef demand as a single concept it is, in fact, the demand for many different beef products, each of which is a separate market. Figure 1 shows the average seasonal pattern of Choice boxed beef prices with a peak in June and lows at the beginning and end of the year. The seasonal price pattern in Figure 1 is the net seasonality from many different beef products, each with unique seasonal patterns. The seasonal indexes in Figures 1-5 and in Table 1 are five-year centered moving averages from 2021-2025. The seasonal pattern for each product shows the percentage variation around the average from the seasonal high to low price.
Table 1 shows the 2025 average price and seasonal price range for the ten most valuable wholesale beef cuts. The highest price beef cuts, Tenderloin and Ribeye, peak at the end of the year, with increased restaurant and holiday demand. This is shown in Figure 2, along with the Chuck flap, the number four beef cut, which has a similar seasonal price pattern.
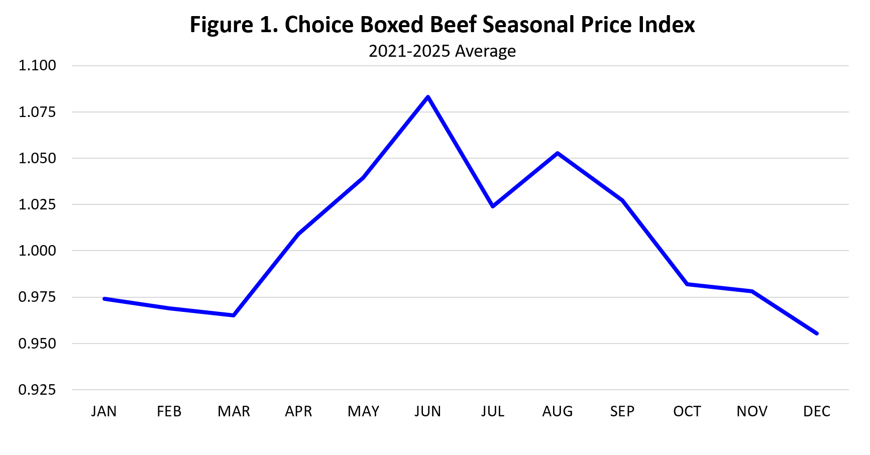
Table 1. Top Ten Wholesale Beef Values, 2025 and 2021-2025 Seasonal Index Range
| Rank | Name | IMPS | Average Price ($/cwt.) | Max Index(Month) | Min Index(Month) |
| 1 | Tenderloin | 189A | 1572.08 | 1.124 (Nov) | 0.911 (Feb) |
| 2 | Ribeye | 112A | 1252.23 | 1.128 (Dec) | 0.884 (Jul) |
| 3 | Strip Loin | 180 | 963.71 | 1.247 (Jun) | 0.830 (Oct) |
| 4 | Chuck Flap | 116G | 813.33 | 1.119 (Nov) | 0.921 (Aug) |
| 5 | Chuck Petite Tender | 114F | 809.94 | 1.139 (Aug) | 0.831 (Jan) |
| 6 | Flank | 193 | 741.52 | 1.204 (Jun) | 0.848 (Dec) |
| 7 | Sirloin Tri-Tip | 185D | 720.35 | 1.262 (Jun) | 0.823 (Oct) |
| 8 | Brisket | 120A | 718.21 | 1.067 (Jun) | 0.915 (Mar) |
| 9 | Short Ribs | 123A | 625.07 | 1.051 (Aug) | 0.955 (Feb) |
| 10 | Sirloin Top Butt | 184 | 563.38 | 1.182 (Jun) | 0.868 (Nov) |
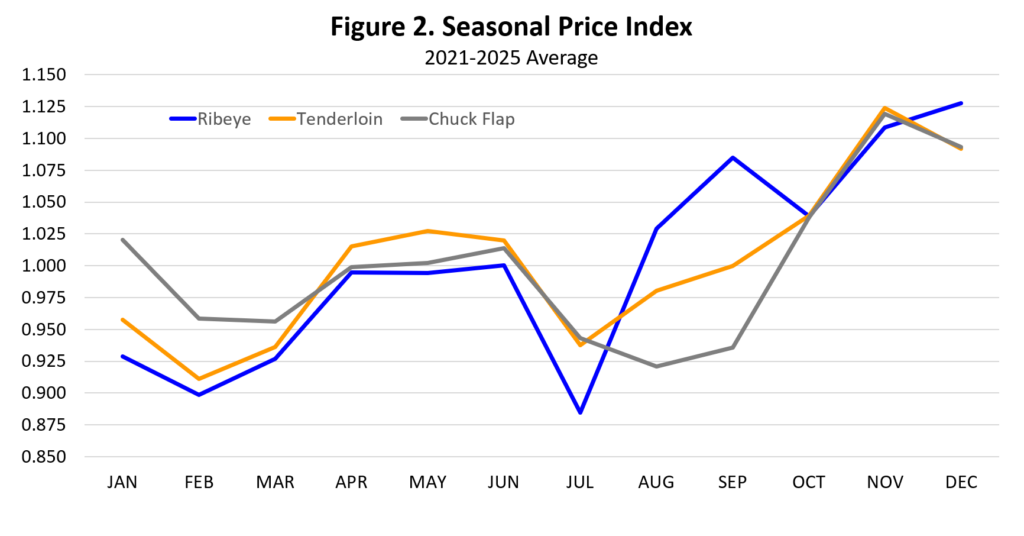
Figure 3 could be called the “Summer Grilling Demand” chart and shows four cuts that all peak in June. These four cuts, Strip loin, Flank, Top Sirloin and Tri-Tip have the most pronounced seasonal patterns and contribute the most to the overall seasonal pattern of boxed beef prices in Figure 1. For example, Tri-Tip price has an average range of 43.9 percent from the peak in June to the October low.
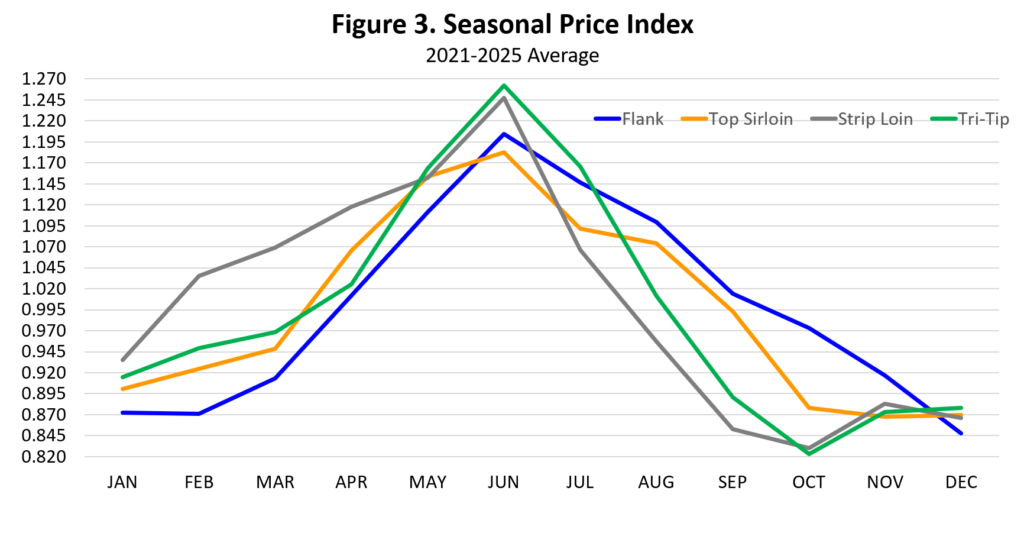
Figure 4 shows the seasonal patterns of three round cuts with very similar seasonal price patterns peaking in the third and early fourth quarter of the year. These relatively low value cuts; Outside Round, Eye of Round, and Bottom Round, are used sometimes for grinding and frequently for other processed beef products, such as jerky and sausage.
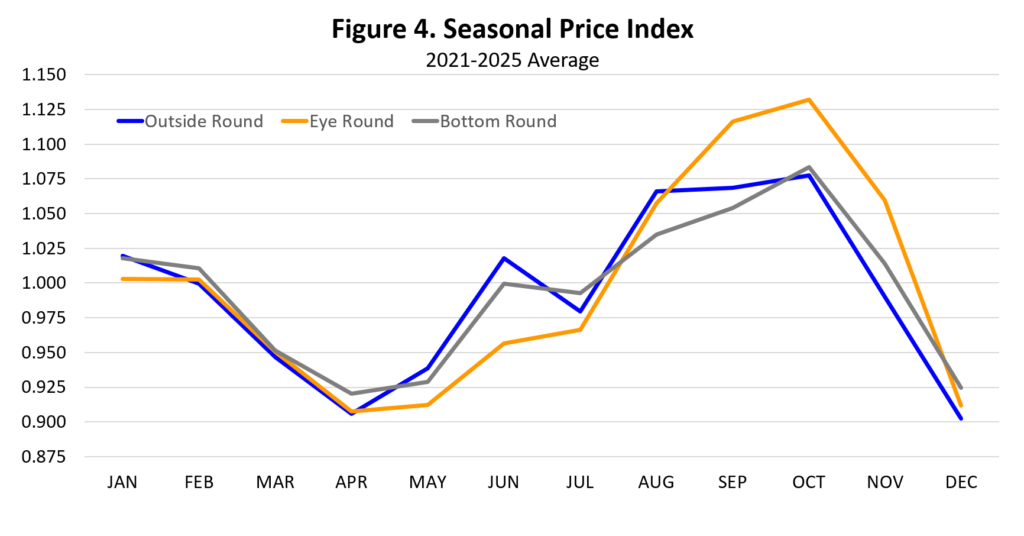
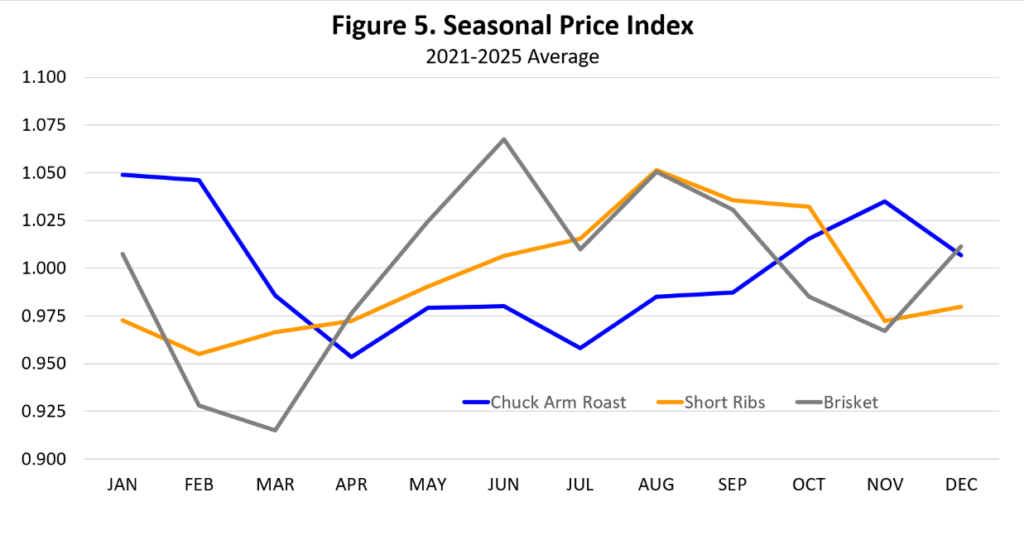
Figure 5 shows three diverse cuts including brisket, which shows some summer demand tendency, peaking in June, along with Short Ribs, which are largely an export product, and Chuck Arm Roast, which tends to have higher prices in cooler weather at the beginning and end of the year. All of these cuts have relatively narrow seasonal price ranges with Chuck Arm Roast and Short Ribs each having less than ten percent variation from the seasonal peak to low price during the year.
There are many other beef products as well, each of which has a distinct seasonal price pattern and each of which contribute to the overall value of each beef carcass and to beef demand.