
A Comparative Analysis of Corn & Soybean Input Costs in the United States and Brazil
U.S. corn growers are the most productive farmers in the world, but even highly productive farms can lose ground globally when they are forced to compete from a higher cost position. A new analysis prepared for the National Corn Growers Association by Kynetec compares what farmers in the U.S. and Brazil pay for major seed and crop protection inputs. The findings show that U.S. growers often pay more than their Brazilian competitors, a difference that matters for farm profitability, the global competitiveness of U.S. agriculture, rural economies, and the long-term strength of U.S. agriculture.
Key Takeaways:
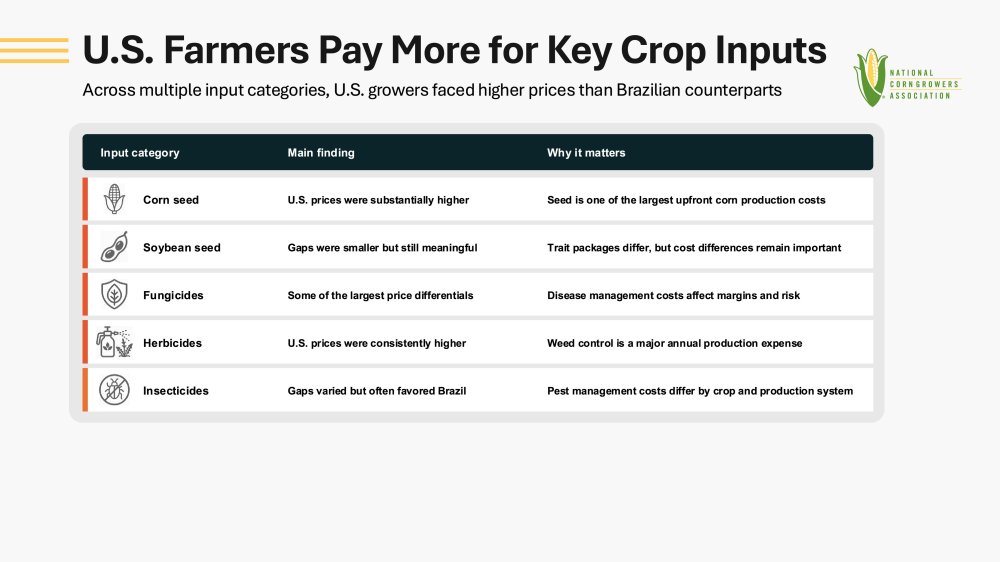
- U.S. growers regularly pay more than Brazilian competitors for major seed and crop protection inputs.
- U.S. farmers face elevated input prices when controlling for exchange rates.
- The largest price premiums are found in corn seed, fungicides, herbicides, and some insecticides; the premiums are substantial enough to affect farm profitability and long-term competitiveness.
- These price gaps remain broadly consistent across farm-size categories within both countries, suggesting that the differences are not limited to a particular segment of producers.
- Differences in product availability, product mix, and market structure contribute to the input-cost gap. Brazilian markets include a larger share of lower-cost single active ingredients, generic products, and products supplied explained by manufacturers outside the major global R&D firms, while the U.S. markets are more heavily weighted toward premium premixes and products from large global manufacturers. However, significant price differences remain even when comparable products are examined.
- Input costs are part of a broader competitiveness challenge that also includes production systems, infrastructure, land costs, logistics, and market access.
- Greater transparency from input providers can help identify where cost differences reflect added value and where opportunities may exist to reduce unnecessary costs. A better understanding of the drivers of cost differences can help inform discussions among growers, suppliers, policymakers, and regulators.
Why Comparisons Are Difficult
U.S. farmers are increasingly interested in how their prices for key crop inputs compares with costs faced by major global competitors, especially Brazil. Yet comparing farm input costs across countries is not simple. Farmers in the U.S. and Brazil operate under different agronomic conditions, regulatory systems, tax structures, pest pressures, logistics networks, product markets, and average farm sizes, all of which can affect production and input purchasing decisions. Although Brazilian farms are generally larger on average, the analysis found that the relative price differences observed between U.S. and Brazilian growers remained largely consistent across farm-size categories within each country. The analysis does not assume every product or production system is directly comparable, but it provides a stronger basis for understanding broad cost differences across major input categories.
Publicly available benchmarks can show what farmers spend per acre or per bushel, but those figures often do not capture differences in product formulations, application rates, taxes, currency effects, or the technologies embedded in seed and crop protection products or the prices, or implied unit prices paid for those products. NCGA partnered with Kynetec to help reduce those comparability challenges. Kynetec maintains a comprehensive global input-price database built from direct farmer-panel data collected from thousands of growers, providing a more detailed and grounded view of what producers in each country are actually paying than is available through public data sets alone. This analysis is focused on seed and pesticide products; fertilizer is notably not evaluated in this report because the Kynetec data available on fertilizer pricing is less robust.
The analysis considers both corn and soybeans, reflecting the central role these crops play in the agricultural economies of both countries. The U.S. is the world’s largest corn producer, while Brazil is the largest soybean producer. In both countries, many farmers grow both corn and soybeans, but the relationship between the crops differs. In the U.S., corn and soybeans are generally grown as alternative crops on the same acres, with only one crop produced each year. In Brazil, however, a large majority of the corn crop follows soybeans, allowing both crops to be produced on the same land within a single annual cycle. These differences in crop rotation and production systems affect how farmers invest in seed, crop protection products, machinery, and land, making direct crop-by-crop cost comparisons more challenging. As a result, evaluating both crops together provides a more complete picture of the relative cost competitiveness of U.S. and Brazilian agriculture.
The Core Finding: U.S. Growers Pay More for Seed and Crop Protection Inputs
The Kynetec analysis shows a consistent pattern: U.S. farmers often pay more than Brazilian farmers for comparable seed and crop protection inputs for both corn and soybeans. The size of the gap varies by crop, input category, product type, and year, but the broader finding is clear: Input-cost differences are large enough to matter for farm margins and long-term viability. The analysis does not assume products are identical across countries but focuses on comparable inputs to identify broad cost differences.