

Weather and geopolitical events continue to impact grain markets. When USDA reports are added to the mix, high volatility is the norm at present. On Friday July 10, USDA released the Crop Production and WASDE reports. The July Crop Production report provides updates of the winter wheat crop. The WASDE puts forth the initial by class balance sheets for U.S. wheat in the 2026-27 crop marketing year. The ensuing price rally in the grain complex found support across these events.
Wheat Market Outlook:
Hard red winter wheat prices moved sharply higher last Friday on geopolitical developments, developing weather issues in the EU, and support from the USDA reports. An escalation of hostilities between Ukraine and Russia saw the closing of the Kerch Strait cutting off a key shipping route for Russian wheat exports. The route in question moves around 25 percent of export capacity from Russia. Any resolution of this issue and its impact on global wheat trade remain opaque. Reports out of France seem to indicate issues in the EU for the wheat crop but it remains early for a consensus to develop around losses to the crop. The USDA reports reflected the production issues in wheat and incorporated the data from the June Acreage and Stocks reports. Prices moved higher across all major wheat futures contracts and continue to work through the information from these developments.
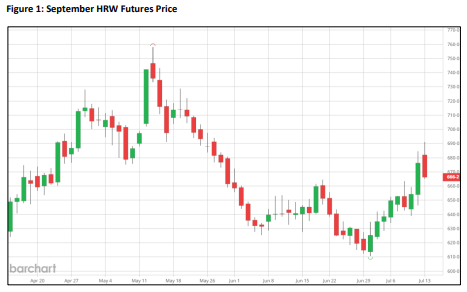
After running up over 20 cents on Friday, the September HRW futures contract fell 10 cents on Monday to close at $6.66 as shown in Figure 1. Futures prices struggles to reach the $7 level despite the poor crop domestically gives a strong indication on dependence of overseas markets or the fortunes of the spring crops to drive a rally. The uncertainty associated with the multiple geopolitical hot spots will continue to inject volatility into markets. In Oklahoma, cash prices for delivery seen in the $6.12 – $6.22 range.
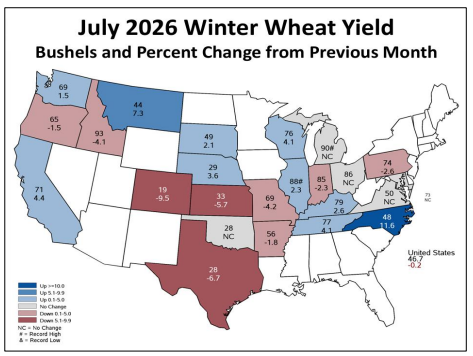
The USDA winter wheat production report for July incorporated the 21.21 million harvested acres from the Acreage report. Yield dropped to 46.7 bushels per acre, down 0.1 bushels from June. As shown in Figure 1, the yield changed varied across the country. In the Southern Plains, Kansas and Texas saw yield fell two bushels per acre from previous estimates to 33 and 28 bushels per acre, respectively. Oklahoma yield remained at 28 bushels per acre. The yield losses continue to pile up in HRW areas while soft red winter wheat yields saw record yields in Illinois and slight increases across most of the SRW area from last month. Despite better yield prospects, SRW production sits at 287 million bushels,
down 66 million from last year.
Total winter wheat production came in at 990.5 million bushels due to lower HRW and soft red winter wheat production. Hard red winter wheat made up 470.9 million bushels of that total, down from 804 million bushels last year. At 1,536 million bushels, all wheat production dropped seven million bushels from the June report. The drop came across most classes with spring wheat acreage falling to 9.07 million acres, down 320 thousand acres, and durum acreage down slightly to 1.78 million acres.
Fundamentals for the old crop and new crop all wheat balance sheets indicated lower ending stocks for both marketing years. Old crop ending stocks fell 15 million bushels from June in a direct reflection of the June 1 reported ending stocks. Feed and residual increased 18 million bushels in 2025-26 while seed usage dropped two million. Exports came in 2 million bushels lower to end the marketing year at 908 million bushels. The impact on the 2026-27 balance sheet saw beginning stocks down 15 million bushels and production down 7 million bushels from acreage and yield data previously discussed. In total, new crop ending stocks fell 22 million bushels to 722.
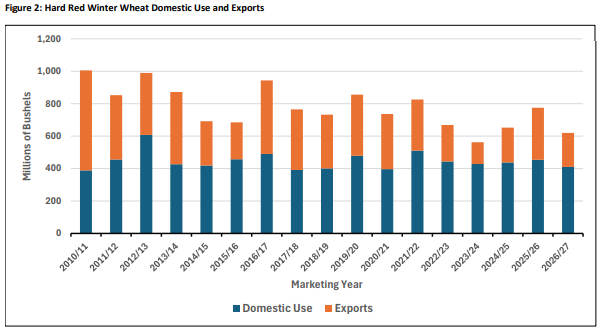
The July WASDE provides the first forecasts for wheat by class for the 2026-27 marketing year. HRW saw old crop feed and residual increased by 15 million bushels along with minor changes to provide ending stocks for 2025-26 of 437 million bushels, down 16 million from June. The new crop balance sheet, as shown in Figure 2, has total usage at 620 million bushels, down from 775 million last year. Exports are projected to equal 210 million bushels in 2026-27, down from 321 last marketing year.
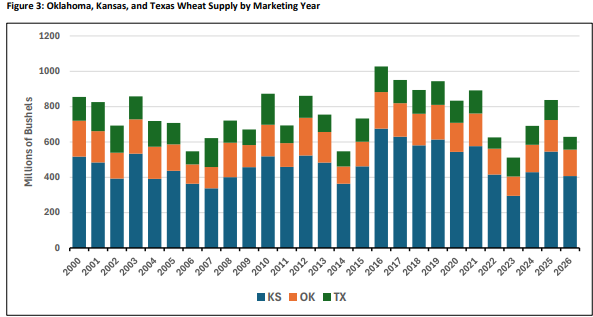
Lower production for hard red winter wheat will continue to provide support. Total supply for HRW is set at 928 million bushels, down from 1,212 last year. Figure 3 shows stocks and production for Oklahoma, Kansas, and Texas for HRW since 2000. While the drop is large for the region, supplies are on par with what occurred in 2022. At 629 million bushels, HRW in the three states is down 209 million bushels. Stocks mitigated the terrible production totals seen coming out of the region.
Despite reports out of the EU of wheat crop issues due to the heat wave, USDA left EU wheat production at 5 billion bushels for 2026-27. One should expect further adjustments to this number as confirmation trickles in on wheat crop damage. World wheat supplies came in slightly lower from last month at 40.4 billion bushels. The change is due to lower beginning stocks around the globe. Russia and Ukrainian wheat production increased by 18 million bushels each to total 3.25 billion and 882 million bushels, respectively. Canadian production is forecast to drop 36 million bushels to 1.25
billion bushels on the Stats Canada Area report. The large crops in the Black Sea region spurred an increase in expected exports with a slight drop in Canadian export levels. Discussion about the super El Nino and impacts on India and southern hemisphere crops in Australia, Africa, and South America will continue over the near term. Outcomes from the heat wave in the EU and geopolitical impacts in the Black Sea and Middle East will impact wheat prices and the competitive status of the U.S. in world markets over the next few months. While there exists upside potential, expect continued volatility and uncertainty to be a prominent feature of wheat markets around the globe.
Corn Outlook:
Corn prices found support at the end of last week as well. An indication, from USDA reports, of continued strong demand along with growing concerns about the corn crop in the EU saw prices move around a dime higher on the December futures contract. December corn futures continue higher into Monday to close at $4.63. Corn in Oklahoma was priced on average around $4.06 per bushel with harvest prices in the $4.28 – $4.38 range.
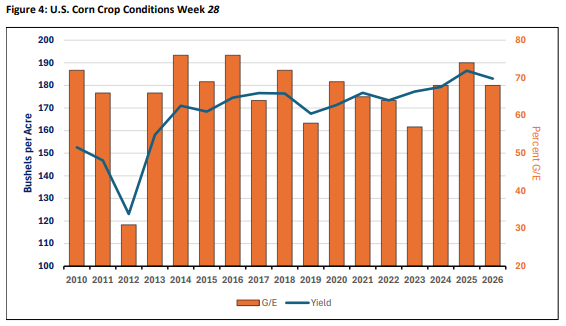
Weather and crop conditions remain the key variables for price formation in corn markets. Corn crop condition ratings through July 12 provide support for the USDA forecast of 183 bushels per acre. As Figure 4 shows, good and excellent crop conditions through Week 28 of this year sit at 68 percent, up one percent from last week. Conditions are on par with 2024 and sit above the five-year average. The amount of the crop in silking and dough stages sit above the average pace. Speculation on the impact of increased heat and dryness in the latter half of July remains strong as key areas of the Corn Belt enter pollination.
Corn demand remains solid. On the back of the June stocks report, old crop corn usage increased by 125 million bushels. Feed and residual usage is pegged at over 5.6 billion bushels through three quarters of the marketing year given the June stocks level. As such, feed and residual usage increased 150 million bushels for the 2025-26 marketing year to 6.2 billion. Corn for ethanol usage dropped by 25 million bushels to 5.55 billion to make up the total change in usage. The adjustment to ethanol usage confirms the lower pace of corn usage thus far in the marketing year. An expectation is in place that
subsequent changes in corn usage for ethanol will be small. All these changes lead to beginning
stocks for 2026-27 falling 125 million bushels. Due to a continuation of strong U.S. corn exports, USDA raised out year exports by 50 million bushels to 3.2 billion. The increase in exports is related to changes in global balance sheets.
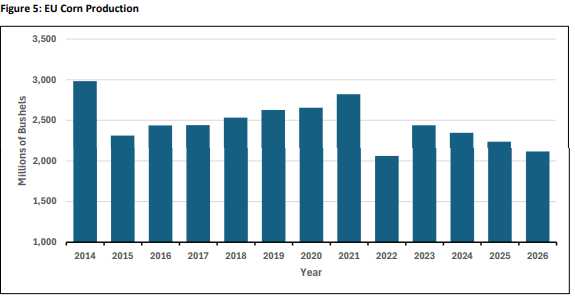
Corn global production for the 2026-27 marketing year was forecast 123 million bushels lower this month at 51.06 billion. The largest reduction in production came from the EU corn crop forecast. EU corn production, as shown in Figure 5, is projected 150 million bushels lower at 2.1 billion. The reduction was due to a severe deterioration in the French crop that places the USDA forecast at the lowest French corn crop in three decades. In offsetting the smaller EU crop, the 2025-26 Argentine crop came in at 2.5 billion bushels after confirmation of harvest results. World corn consumption is
forecast down slightly at 52 billion bushels. Canada and the U.S. saw corn exports moved higher for the
new crop year. The reduced EU crop saw imports increased for the EU and MENA region countries.
Ending stocks decreased to 10.84 billion bushels, down 235 million bushels from last month.