

Grant Gardner writes in Southern Ag Today: In the October WASDE (USDA-WAOB, 2026), USDA raised soybean yield expectations by 0.3 bushels to a record 53.1 bushels per acre, which lifts production by 27 million bushels to a record 4.56 billion. A bigger crop did not lower USDA’s season-average price projection. USDA also cut beginning stocks by 10 million bushels and raised exports by 10 million, so carryout rose only 5 million bushels to 315 million and the projection held at $12.00 per bushel. Prices have slipped since the report. November soybean futures closed up 4.5 cents at $12.92 on report day, then lower five days in a row, to $12.61 on October 16 (Barchart, 2026).
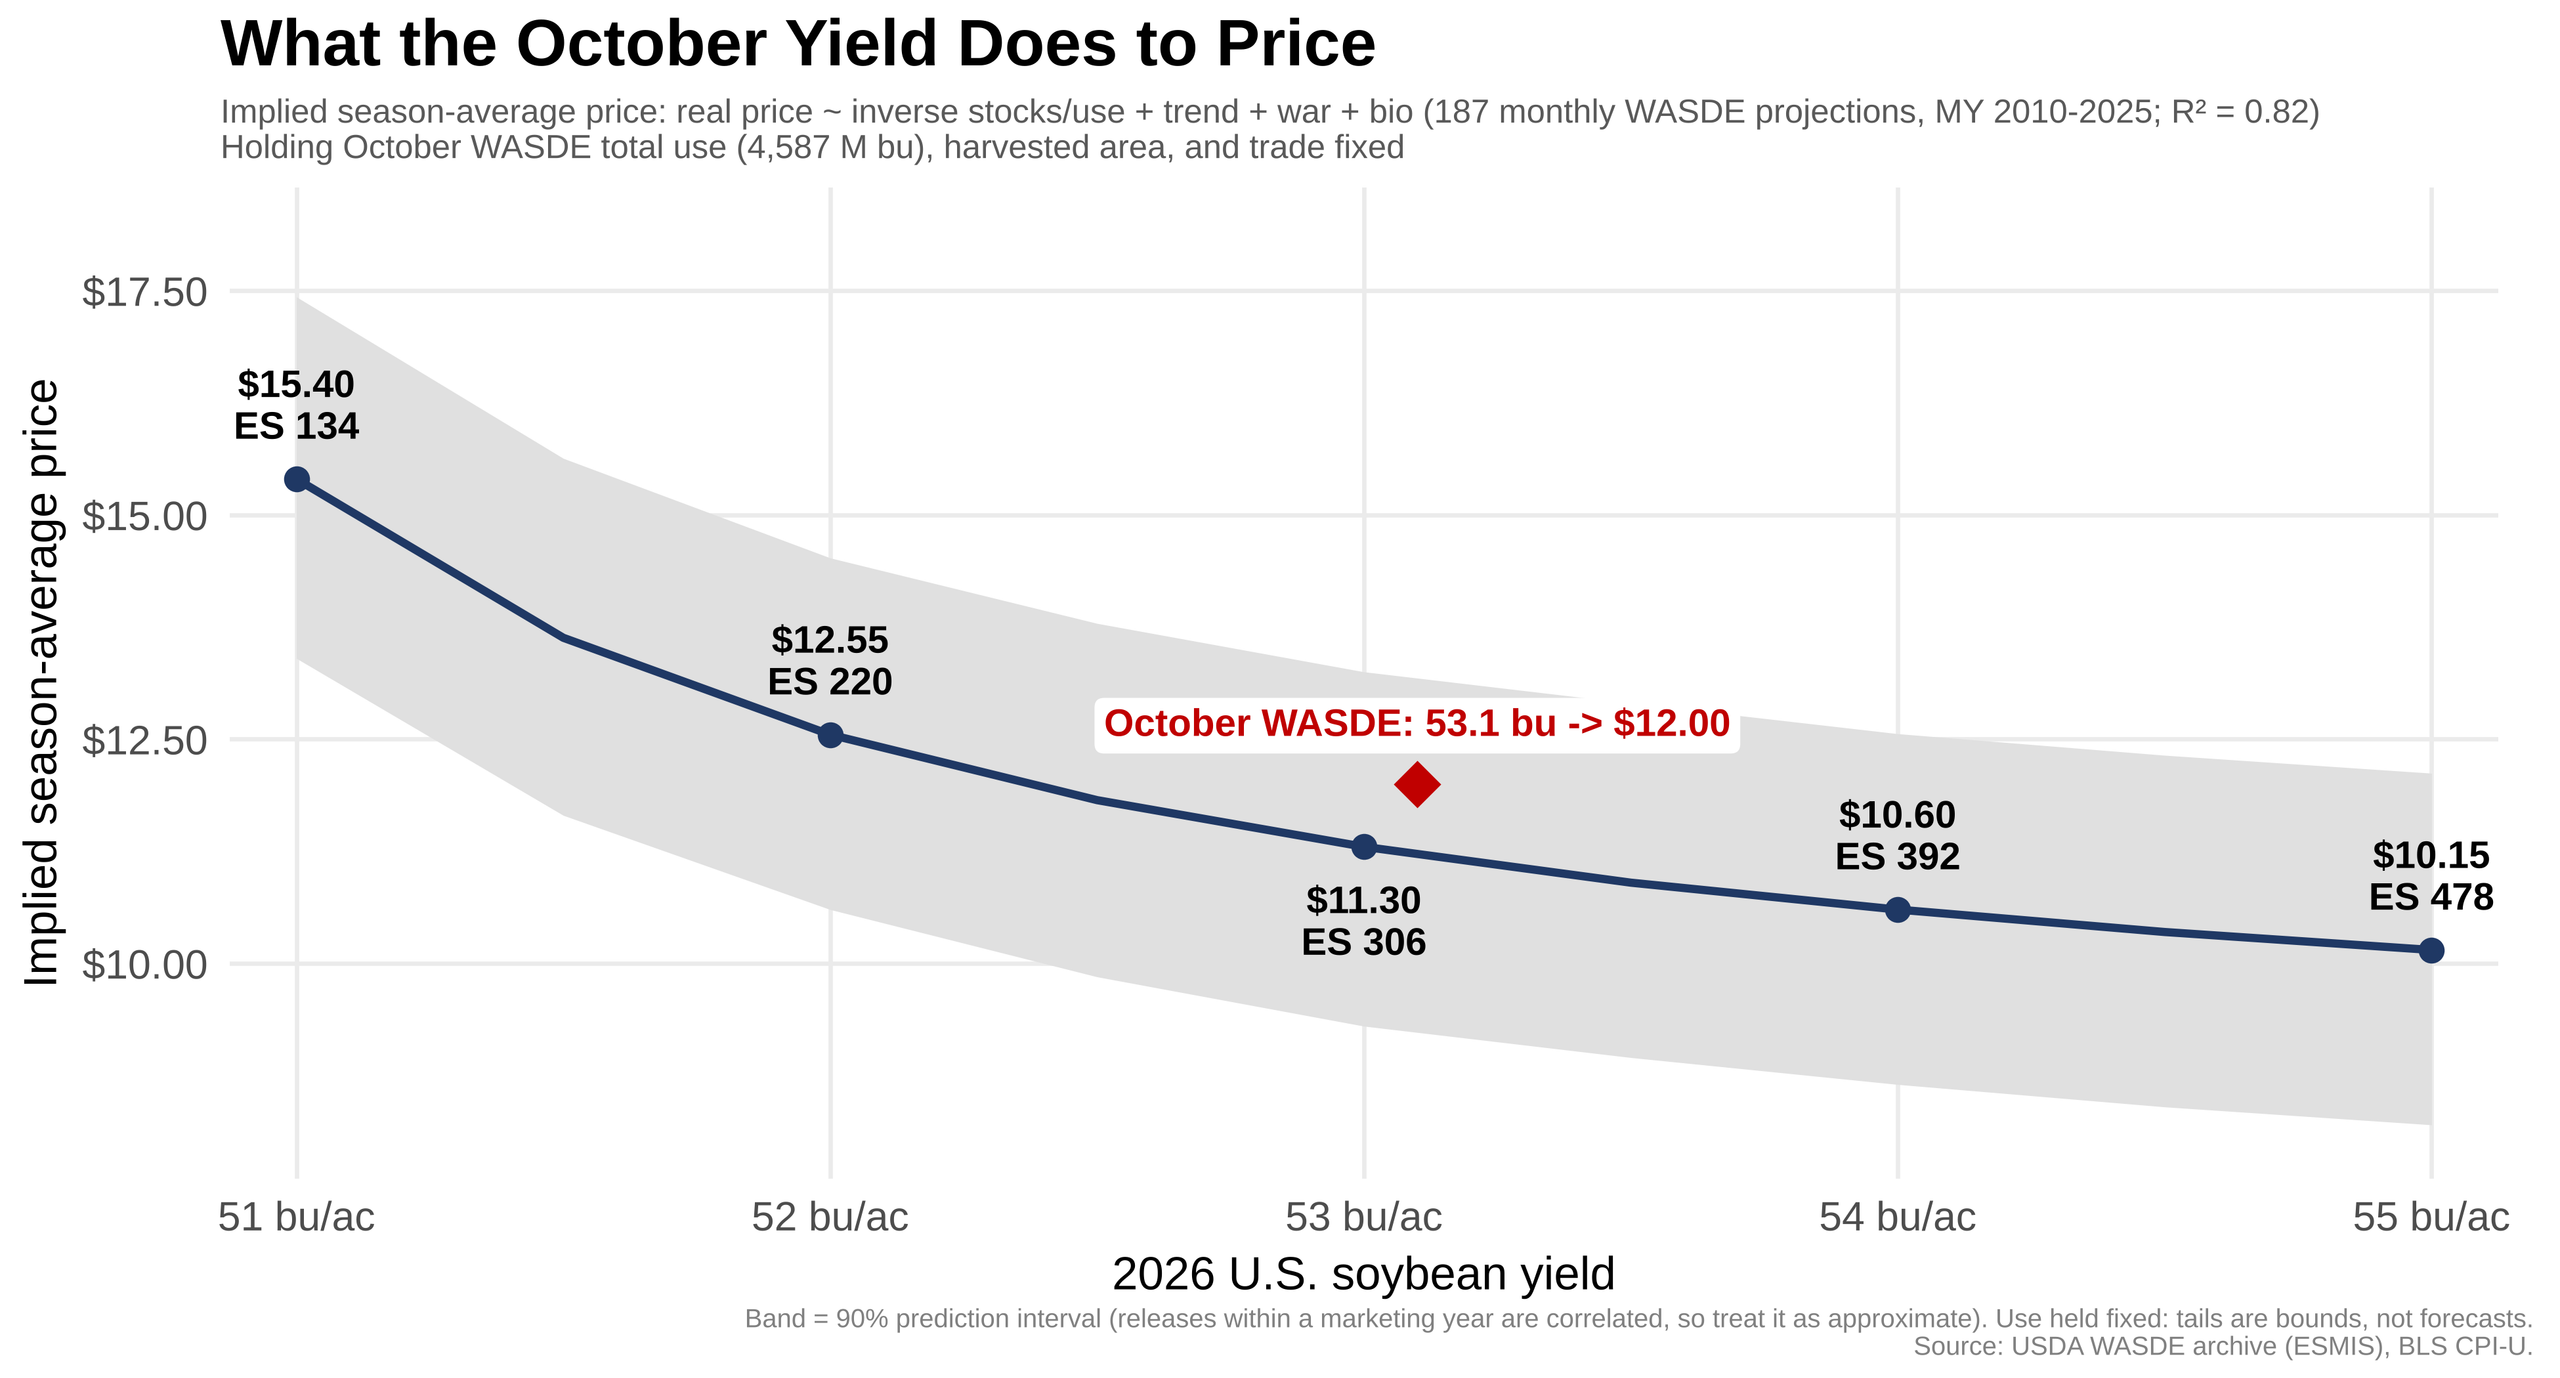
Figure 1 shows what USDA has usually projected for price at each carryout since 2010 (USDA-WAOB, 2026; BLS, 2026). At 315 million bushels, that is $11.21. This time USDA is projecting $12.00, which is $0.79 higher.
Part of the reason is biofuels. EPA’s final rule in March raised the 2026 and 2027 biomass-based diesel requirements to 67 and 70 percent above 2025 levels (Hubbs, 2026), and USDA now has 17.8 billion pounds of soybean oil going to biofuel, up from 14.8 billion last year. Crush is projected at a record 2.78 billion bushels, up 134 million (USDA-WAOB, 2026).
The other part is exports. USDA projects 1.695 billion bushels, up 180 million from last year, and sales back it up. Total sales, shipped and not yet shipped, were 23.4 million metric tons as of October 8, up 74 percent from a year ago (USDA-FAS, 2026). China holds 11.3 million metric tons of that, nearly half, after buying nothing at this point last year. The trade deal calls for China to buy at least 25 million metric tons a year in 2026, 2027, and 2028 (White House, 2025). Sales are at 51 percent of USDA’s export projection, a normal pace for this time of year (43 to 54 percent of final exports in 2022/23 through 2024/25).
Figure 1 also shows that price reacts more when carryout shrinks than when it grows. Going from 53 to 52 bushels per acre cuts carryout by 86 million bushels and adds $1.25 to the price. Going from 53 to 54 grows it by the same amount and takes off only $0.70. Demand works the same way, since 86 million bushels is about 5 percent of USDA’s export projection.
A gap this size is not proof that USDA is wrong. The shaded band is the range history has covered about 90 percent of the time, $9.25 to $13.20 at 53.1 bushels, and $12.00 is inside it. The chart also holds demand fixed, so real price swings would be smaller than shown.
The $12.00 projection depends on demand staying strong, and prices have already started to slip as the harvest hits full swing in northern states (USDA-NASS, 2026). Producers with unpriced beans may want to spread sales out and watch the weekly export sales reports for any sign that demand is weakening. The November 10th WASDE is the other date to watch. History suggests a smaller yield would add more to price than a bigger one would take off.
Figure 1. Implied 2026/27 season-average soybean price across a range of possible yields, holding the rest of the October WASDE fixed. ES is ending stocks, or carryout, in million bushels. The red point is USDA’s October projection; the shaded band is a 90 percent prediction interval.
Gardner, Grant. “Can Soybean Demand Keep Prices Near $12?” Southern Ag Today