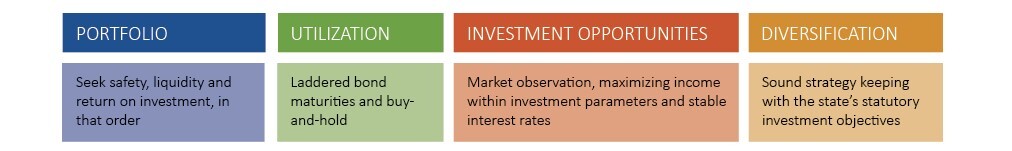
PORTFOLIO PERFORMANCE, DIVERSIFICATION, AND STRATEGY
March portfolio yielded 3.69%, up from 3.62% last year, with a weighted average maturity of 736 days.
Total assets under management of $17.2 billion, down $200 million in comparison to March 2025.
Total portfolio contained 67.1% in U.S. Treasurys, 0.4% in U.S. government agencies,
19.6% in money market mutual funds, 11.6% in mortgage-backed securities, 0.4% in certificates of deposit,
and 0.7% in state and foreign bonds, comprising the balance of funds invested.
TOTAL FUNDS INVESTED
Funds available for investment at market value include the State Treasurer’s investments at $11,574,076,190. State Agency balances in OK Invest at $3,719,250,815, American Rescue Plan investments at $668,656,697, and the Oklahoma Capitol Improvement Authority Legacy Fund at $1,127,131,926, Oklahoma Capital Assets Maintenance and Protection Fund at $124,133,660 for a total of $17,213,249,289.
MARKET CONDITIONS
Treasury yields rose across all maturities in March as markets responded to a significant jump in inflation, escalating geopolitical uncertainty in the Middle East, and a sharp rebound in energy prices. The 2-year Treasury yield ended the month at 3.80%, up 42 basis points from February month-end, while the 10-year Treasury yield rose 38 basis points to close at 4.32%. The 3-month yield edged up 2 basis points to 3.68%, and the 30-year yield climbed 30 basis points to 4.91%. The yield curve flattened modestly between the 2-year and 10-year periods, with the short end rising more sharply than longer maturities, while the front end remained comparatively stable. The overall shift in yields reflected growing market concern about rising inflationary pressures and geopolitical uncertainty rather than slowing economic momentum.
Equity markets declined broadly with the Dow Jones Industrial Average falling 5.38% for the month, while the S&P 500 and the Nasdaq Composite declined 5.09% and 4.75%, respectively. Mounting investor concern over the economic consequences of sweeping tariff policies, rising energy prices linked to Middle East conflict, and the prospect of a more prolonged period of elevated inflation weighed heavily on all three indices. Year to date, the Dow was down 3.58%, the S&P 500 declined 4.63%, and the Nasdaq Composite dropped 7.11%.
The Federal Open Market Committee (FOMC) held its March meeting voting 11-1 to hold the federal funds rate at 3.50% – 3.75%. The minutes noted heightened uncertainty over the economic outlook, citing the conflict in the Middle East as a source of sharp energy price increases and near-term inflation pressures. The vast majority of participants judged progress toward the 2% objective to be slower than previously anticipated, and the inflation risk running persistently above target increased. The Committee stands prepared to adjust its policy stance as appropriate if conditions were warranted.
ECONOMIC DEVELOPMENTS
Labor market conditions partially recovered in March. According to the Bureau of Labor Statistics (BLS), nonfarm payroll employment increased by 178,000, following a decline of 133,000 in February, with gains concentrated in health care (+76,000), construction (+26,000), and transportation and warehousing (+21,000). The unemployment rate declined to 4.3%, from February’s 4.4%. Federal government employment continued to decline, falling 18,000 in March and bringing total federal job losses to 355,000, or 11.8%, since reaching a peak in October 2024. Average hourly earnings rose 0.2% month over month and 3.5% year over year. The labor force participation rate edged down to 61.9%. January payrolls were revised upward by 34,000 while February payrolls were revised downward by 41,000, resulting in a combined net downward revision of 7,000 positions.
The Consumer Price Index rose 3.3% year over year in March, up from 2.4% in February, according to the BLS. The Core CPI, which excludes food and energy, rose 0.2% from February and increased to 2.6% year over year, up from the 2.5% pace recorded in February. On a monthly basis, the all-items index surged 0.9%, driven primarily by a 10.9% jump in energy prices, with gasoline prices rising 21.2% and accounting for nearly three-quarters of the monthly headline increase. The sharp monthly acceleration represented a meaningful reversal from the gradual disinflation trend observed in prior months, with inflation now running further above the Federal Reserve’s 2% target.
The Producer Price Index for final demand increased 0.5% month over month in March, matching the 0.5% pace recorded in February, and bringing the year-over-year increase to 4.0%, the largest 12-month advance since February 2023. According to the BLS, the March increase in producer prices was driven by a 1.6% advance in final demand goods, led by a rise in gasoline prices, while indexes for diesel fuel, jet fuel, home heating oil, meats, and primary basic organic chemicals also increased. Final demand services were unchanged for the month. The index for final demand, less food, energy, and trade services rose 0.2% during the month and 3.6% year over year, the largest 12-month advance since November 2025.
Retail sales advanced in February 2026. According to the U.S. Census Bureau, advance estimates of retail and food services sales totaled $738 billion, up 0.6% from January 2026 and up 3.7% from February 2025. January 2026 sales were revised to $734 billion, a decline of 0.1% from the prior month. Retail trade sales rose 0.6% month over month and 3.5% year over year. Non-store retailers posted strong year-over-year growth of 7.5%, while food service and drinking places rose 5.2% from February 2025, reflecting continued resilience in consumer spending in those categories.
The housing sector softened in March. According to the National Association of Realtors, existing home sales declined 3.6% month over month to a seasonally adjusted annual rate of 3.98 million units. Unsold inventory rose 3.0% to 1.36 million units, representing 4.1 months of supply, up from 3.8 months in February. On a year-over-year basis, existing home sales fell 1.0%, while the median existing home sales price rose 1.4% to a record $408,800 for the month of March. NAR Chief Economist Dr. Lawrence Yun noted that housing inventory remained below historical norms and that lower consumer confidence and softer job growth continued to restrain buyer activity.
Real GDP increased at an annualized rate of 0.5% in the fourth quarter of 2025, according to the third estimate released by the U.S. Bureau of Economic Analysis, a downward revision of 0.2% points from the second estimate and a significant deceleration from the 4.4% pace recorded in the third quarter. Consumer spending and investment were the primary contributors to growth, while government spending and exports declined. Despite the deceleration in the pace of growth, the overall economy continued to expand, reflecting continued but moderating resilience in economic activity.