In 2025, total cattle slaughter was 29.252 million head, down 6.4 percent year over year and down 13.1 percent from the recent cyclical peak in 2022. Cattle slaughter in 2025 was at the lowest level since 2015. Table 1 shows the breakdown of 2025 cattle slaughter by size categories of beef packing plants. This includes both fed and cow slaughter plants. Out of a total of 937 federally inspected packing plants, 94.8 percent (888 plants with capacity up to 100,000 head per year) accounted for 1.92 million head, 7.14 percent of total slaughter. By contrast, a total of eleven plants, with capacity in excess of one million head per year, accounted for 13.834 million head, or 47.3 percent of total cattle slaughter. On average, fed slaughter is about 80 percent of total cattle slaughter. These eleven plants accounted for 58.1 percent of fed slaughter (Figure 3). Fed slaughter is currently 81.4 percent of total cattle slaughter, the highest percentage since 2007. Low cow slaughter since 2022 has increased the fed slaughter percentage.
Table 1. Beef Packing Industry Structure by Size, 2000 and 2025.
| 2000 | 2025 | |||||||
| Size | # of Plants | Head | Avg Capacity | % of Total | # of Plants | Head | Avg Capacity | % of Total |
| Head/Year | 1000 HD | Head/Day | 1000 HD | Head/Day | ||||
| 1-999 | 546 | 160.2 | 1.15 | 0.4 | 677 | 223.7 | 1.30 | 0.8 |
| 1,000 – 9,999 | 99 | 329.4 | 13.1 | 0.9 | 174 | 408.2 | 9.2 | 1.4 |
| 10,000 – 49,999 | 27 | 644.3 | 93.6 | 1.8 | 25 | 586.4 | 92.0 | 2.0 |
| 50,000 – 99,999 | 11 | 786.2 | 280.3 | 2.2 | 12 | 869.3 | 284.1 | 3.0 |
| 100,000 – 199,999 | 15 | 2,277.3 | 595.4 | 6.4 | 11 | 1,630.3 | 581.2 | 5.6 |
| 200,000 – 299,999 | 6 | 1,483.3 | 969.5 | 4.2 | 7 | 1,773.7 | 993.7 | 6.1 |
| 300,000 – 499,999 | 9 | 3,590.0 | 1,564.3 | 10.1 | 13 | 5,119.0 | 1,544.2 | 17.5 |
| 500,000 – 999,999 | 9 | 5,297.5 | 2,308.3 | 14.9 | 7 | 4,806.6 | 2,692.8 | 16.4 |
| >1,000,000 | 16 | 21,063.2 | 5,162.5 | 59.1 | 11 | 13,834.7 | 4,932.2 | 47.3 |
| Total | 738 | 35,631.4 | 937 | 29,252.0 | ||||
Source: Livestock Slaughter Summary, USDA-NASS, 2001 and 2026
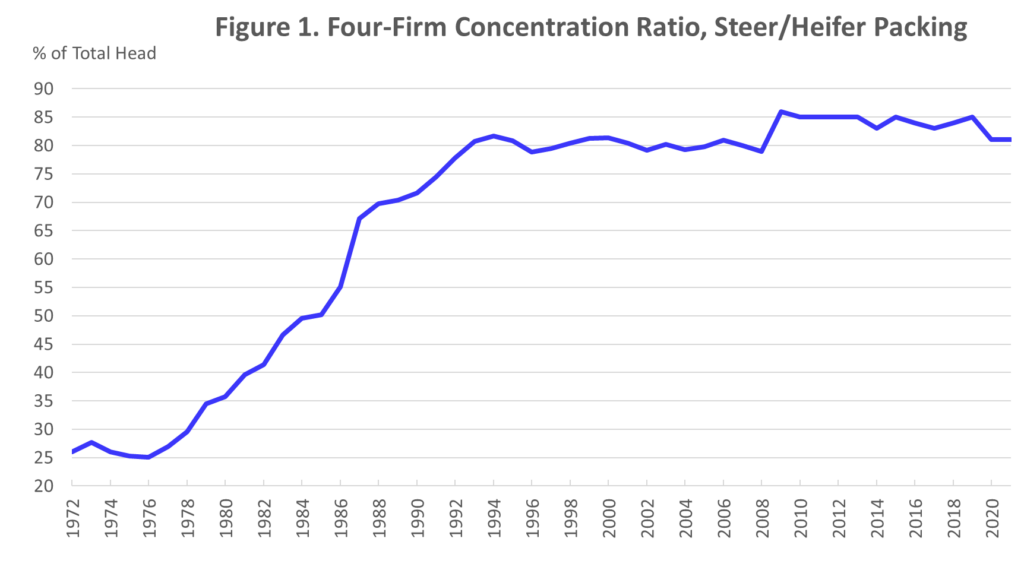
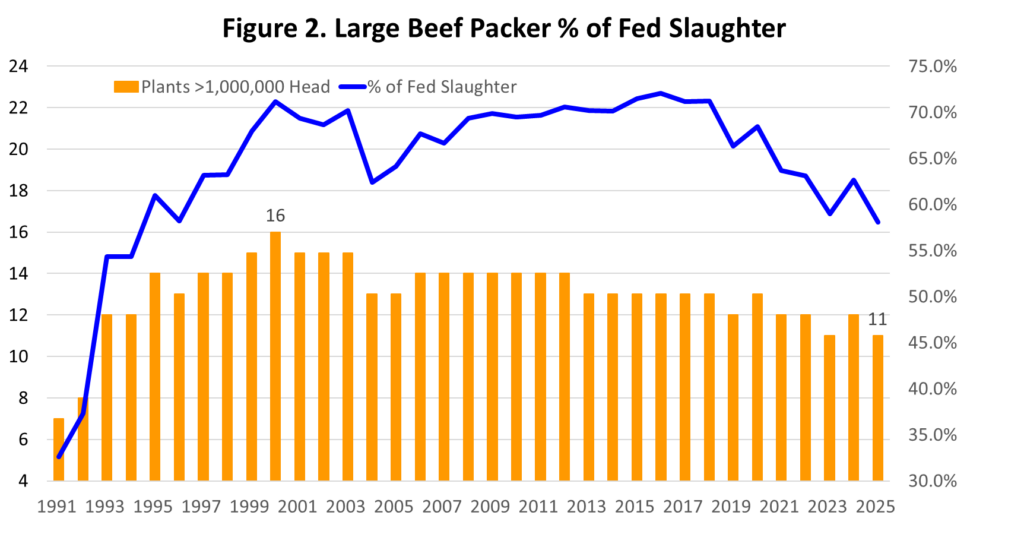
The general structure of the beef packing industry has been in place for nearly 35 years. Figure 1 shows the four-firm concentration ratio for beef packing as calculated by the Packers and Stockyards Division of USDA. Beef packing in the U.S. consolidated rapidly in the 1980s and early 1990s. By 1993, the industry achieved a high level of concentration that has remained mostly constant since. The annual Livestock Slaughter summary first reported plants with a capacity of one million head or more in 1991. The number of large plants has varied between sixteen plants in 2000 to the current eleven plants in 2025. The closure of the Lexington, Nebraska plant this year will drop the number of one million+ head plants to ten.
Table 1 shows that the basic size structure in 2025 is not appreciably different than in 2000, the only year with 16 large plants. Fed slaughter was at a record level of 29.6 million head in 2000 and has dropped to 23.8 million head in 2025, a decrease of 19.5 percent. However, Figure 2 shows that large plants have been accounting for a declining percentage of fed slaughter since 2019, with the current percentage the smallest since 1994.
Source: Packers and Stockyards Division, USDA
Between 1991 and 2007, the total number of federally inspected beef packing plants decreased from 1,031 plants to 626 plants. Recent interest in small packing plants has resulted in the total number increasing since 2021 to 937 plants in 2025. Plants with less than 100,000 head capacity accounted for 3.9 percent of cattle slaughter in 2007 and has increased to 7.1 percent in 2025.
Derrell Peel breaks down how global beef markets are shifting and what that means for U.S. cattle producers today on the Cattle USA Daily Podcast from May 4, 2026 at https://www.youtube.com/watch?v=oAID-B36kQI