To view the latest Oklahoma drought map, CLICK HERE.
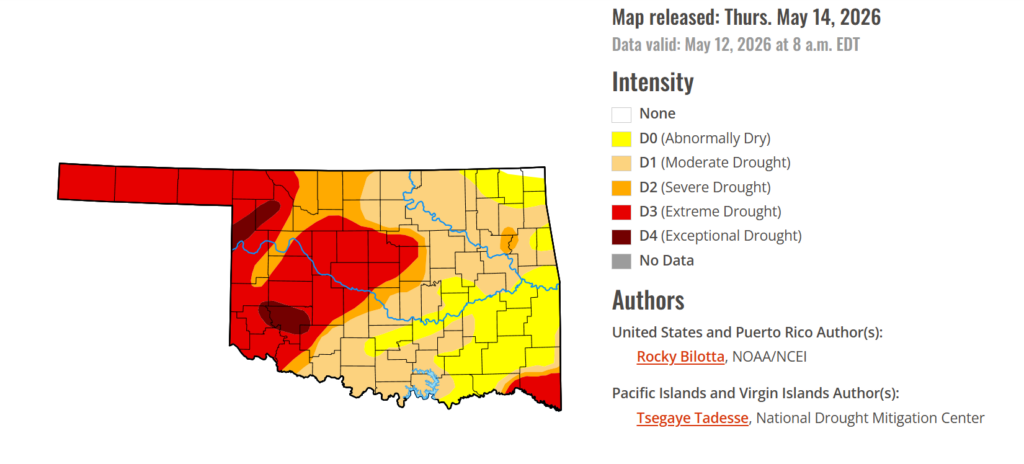
Despite several rounds of much-needed rainfall across Oklahoma in recent weeks, drought conditions continue to tighten their grip on large parts of the state, and now, for the first time this year, exceptional drought has emerged across portions of western Oklahoma. Historically, exceptional drought is devastating for farmers and ranchers, bringing soaring hay and water costs, shrinking supplies, failing crops, bare pastures, and in many cases forcing producers to liquidate cattle herds just to survive. Nearly 80 percent of the state remains under moderate to extreme drought conditions, while less than one percent of Oklahoma is currently drought-free. Even with additional rain chances in the forecast through late May, many producers across western Oklahoma are facing deep concern as dry conditions continue to take a heavy economic toll on rural communities.
According to the latest Oklahoma Drought Monitor, exceptional drought has emerged for the first time this year in Kiowa County, Ellis County, Woodward County, and parts of surrounding areas covering 2.90% of the state. Historic impacts of exceptional drought include: rising hay and water costs and supplies becoming scarce; producers are liquidating herds. Ranchers and farmers are desperate and experiencing huge economic losses. Ground is cracking; farmers are bailing failed crops or abandoning fields; pastures are bare; land is abandoned
Moderate to extreme drought conditions in the current period indicate that 79.74% of the state is affected in those categories.
At this point, only 0.44% of the state remains drought-free in far northeastern Oklahoma.
Southeastern Oklahoma is still seeing drought conditions ease, except in McCurtain County, where extreme drought lingers in the south, with other areas shifting into the lower drought tier of abnormally dry conditions.
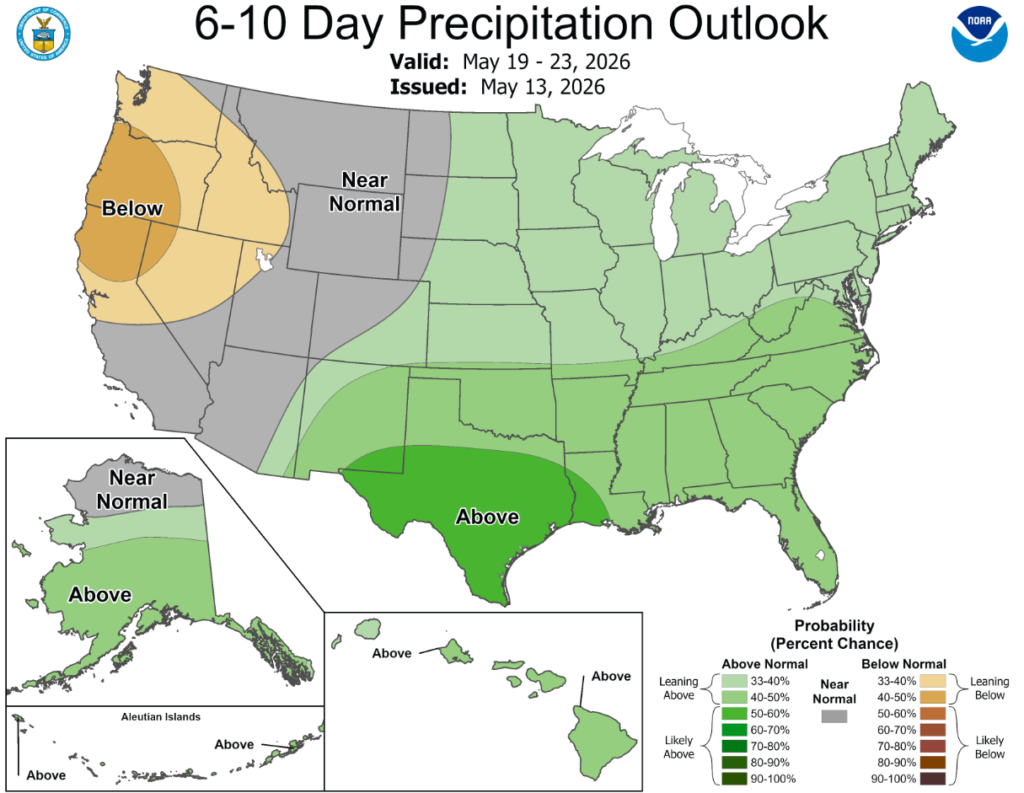
According to the 6-to-10-day precipitation outlook map, all of Oklahoma is leaning above 40-50% chance of precipitation through May 23rd.
This week was defined by a significant precipitation divide, highlighted by a major deluge across parts of the South and Gulf Coast. Persistent storm systems funneled heavy moisture into Louisiana, Mississippi, and Alabama, where total rainfall reached 4 to 6 inches—and in some coastal pockets even higher—representing departures of 3 to 5 inches above seasonal norms. While an active frontal corridor brought a secondary band of moderate rain (1 to 3 inches) from Texas through the Ohio Valley and into the Northeast, the Western U.S. remained exceptionally dry, with most areas west of the Rockies receiving less than 0.1 inch of rain. This lack of moisture, paired with blustery winds, triggered extreme fire danger across the Upper Mississippi Valley, though the period concluded with a pattern shift as a significant Pacific low-pressure system finally moved onshore to deliver moisture to the Northwest. Temperature patterns showed an equally sharp geographical split, with unseasonable warmth gripping the West and parts of the South while a late-spring chill lingered over the North. In the Southwest and South Texas, summer-like heat took a firm hold as Rio Grande Village, Texas, hit a national high of 105°F and Death Valley consistently reached the triple digits; overall, the Western U.S. averaged 5 to 15°F above normal. Conversely, a significant cool-down settled over the Northern Plains and Upper Midwest, where the Dakotas and Minnesota experienced temperatures 5 to 15°F below seasonal averages. This thermal contrast was further sharpened by winter-like conditions in high-elevation regions of the West, where stations in Utah recorded lows as cold as 10°F, even as record-challenging warmth began to expand across the Pacific Northwest and the Southern Border states.
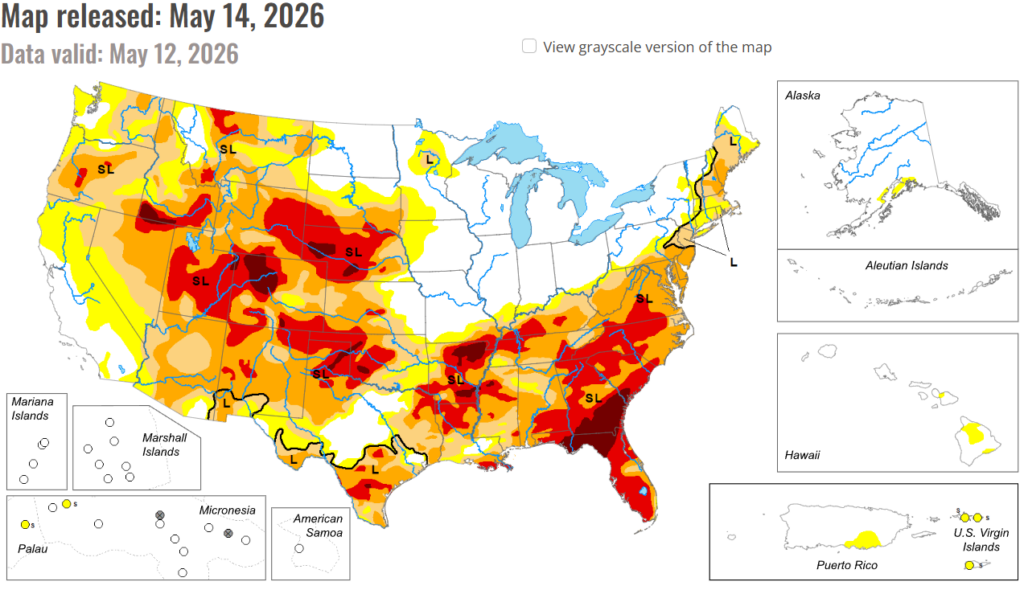
In the South: The Southern region experienced a stark contrast in both precipitation and temperature during the week, defined by torrential Gulf Coast rains and a significant late-spring chill across the interior. Precipitation was most intense across the central Gulf Coast, particularly in Louisiana and southern Mississippi, where weekly totals reached 7 to over 9 inches. These amounts represent exceptional departures of 6 to 7.5 inches above normal. Moderate (D1) to Exceptional (D4) drought was reduced in southern and eastern portions of Texas, and in parts of Louisiana, Mississippi, and southern Tennessee. Abnormal dryness (D0) was improved in parts of Texas and southern Louisiana. Conversely, drier conditions prevailed in West Texas, Oklahoma, and much of the Tennessee Valley, where precipitation was generally 1.5 to 3 inches below average. Exceptional (D4) was introduced in southwest Oklahoma and from the Texas Panhandle into northwest Oklahoma, and expanded in parts of Arkansas and northern Mississippi. Extreme (D3) expanded in northern portions of Texas and western Oklahoma. Heat persisted in southern Texas, where average temperatures reached the 80s and 90s, representing departures of up to 5°F above normal. However, a powerful cold anomaly gripped the northern, eastern, and central portions of the region. In these areas, temperatures were broadly 5 to 10°F below normal for the week.
In the High Plains: Anomalous warmth dominated most of the High Plains this week, while precipitation was defined by a significant east-west gradient. The eastern portions of the region, remained under a persistent late-spring chill with average temperatures falling 4°F to 10°F below seasonal norms. This area was also exceptionally dry, receiving less than 0.05 inches of rain, which resulted in precipitation deficits of 0.6 to 1.2 inches. Persistent dryness resulted in the expansion of exceptional (D4) drought in Nebraska, while and moderate (D1) to extreme (D3) drought were expanded in northeastern Wyoming, South Dakota, Nebraska, and Kansas. In contrast, the western High Plains across Wyoming, much of Colorado, and western portions of South Dakota and Nebraska, experienced unseasonable warmth, with departures ranging from 2°F to 6°F above normal. This warmth was accompanied by an active moisture corridor through the southern High Plains; while northern and eastern reaches were dry, portions of Colorado and adjacent areas of Wyoming and Kansas recorded 0.7 to 1.6 inches of precipitation, ranging from 0.3 to 0.9 inches above normal. This above-normal precipitation resulted in the removal of exceptional (D4) and reduction of extreme (D3) drought in Wyoming, and improvements to severe (D2) to exceptional (D4) drought in Colorado and severe (D2) to extreme (D3) drought in western Kansas.
In the West: The West was characterized by unseasonable warmth and widespread dryness across the Pacific Coast and Great Basin, contrasted by cooler, more active conditions in the Rocky Mountains this week. The eastern portion of the region—specifically eastern portions of Montana, Utah, and New Mexico—remained notably cooler, with departures ranging 3°F to 6°F below normal. However, most of the region, particularly in parts of Oregon, California, and Nevada, experienced significant temperature departures of 6°F to over 12°F above normal, with actual average readings in the Desert Southwest reaching the 80s and 90s. This heat was paired with minimal moisture, as coastal and interior basin states recorded less than 0.1 inches of rain, resulting in precipitation deficits of 0.6 to 1.5 inches below seasonal averages. Exceptional (D4) drought was expanded in southern Idaho, while extreme (D3) drought was introduced in Oregon and expanded in Montana, Idaho, and Nevada this week. Severe (D2) and moderate (D1) drought were expanded in Oregon, Idaho, and Montana. Severe (D2) drought was also introduced in northern Washington and expanded in northern Nevada. Conditions deteriorated over parts of southwest Washington and northwest Oregon resulting in the expansion of abnormal dryness (D0) in these areas. Conversely, localized moisture resulted in the moderate (D1) to severe (D2) drought and abnormal dryness (D0) improvements in southern Arizona, while improvements to moderate (D1) drought occurred in parts of western Nevada.
To view the 6-10 Day Precipitation Outlook Map, click here.
To view the 6-10 Day Temperature Outlook Map, click here.
To view the Monthly Drought Outlook Map, click here.