

Grant Gradner writes in Southern Ag Today: Recent bullishness in corn and soybean futures has been driven by a tightening balance sheet in both crops. Demand has expanded, and weather in key growing areas has trimmed supply. That weather is now showing up in the USDA crop condition ratings (USDA-NASS, 2026), and the Pro Farmer Crop Tour came in well below USDA on corn (Pro Farmer, 2026), which has set off a good deal of online debate about yield estimation.
August is the first WASDE of the year in which USDA revises yields using survey data rather than trend, and it is where the largest yield revisions of the season cluster (Gardner, 2026). Those revisions do not stop in August: since 2010, the final corn yield has differed from the August estimate by an average of 3.8 bushels, landing below it in 11 of 16 years, and soybeans have differed by 1.5 bushels. In the August WASDE (USDA-WAOB, 2026), USDA cut corn yield expectations by 2.3 bushels to 180.7 bushels per acre and soybean yields by 0.3 bushels to 52.7 bushels per acre.
Meanwhile, the Pro Farmer Crop Tour, which samples fields across Ohio, Indiana, Illinois, Iowa, Minnesota, Nebraska, and South Dakota, estimated corn at 173.2 bushels per acre and soybeans at 53.3 bushels per acre. That puts the Tour 7.5 bushels under USDA on corn and 0.6 bushels over USDA on soybeans. Those seven states account for roughly two-thirds of U.S. corn and soybean production, and the Tour does not sample the rest, so the national figure carries an editorial judgment for the remaining third of the crop.
While the online discussion has focused on the size of that corn gap, the historical record suggests it means less than it appears. Figure 1 shows the average difference between the Pro Farmer Crop Tour estimate and four USDA yield numbers from 2016 through 2025: the August, September, and October WASDE, and the final yield. On corn, the Tour sits below all four, and the gap narrows at every step, from 3.5 bushels against the August number to 2.3 bushels against the final. USDA moves toward the Tour as the season progresses, but never all the way. On soybeans, the same progression appears at a far smaller scale, running from 0.1 bushels below the August number to 0.4 bushels above the final.
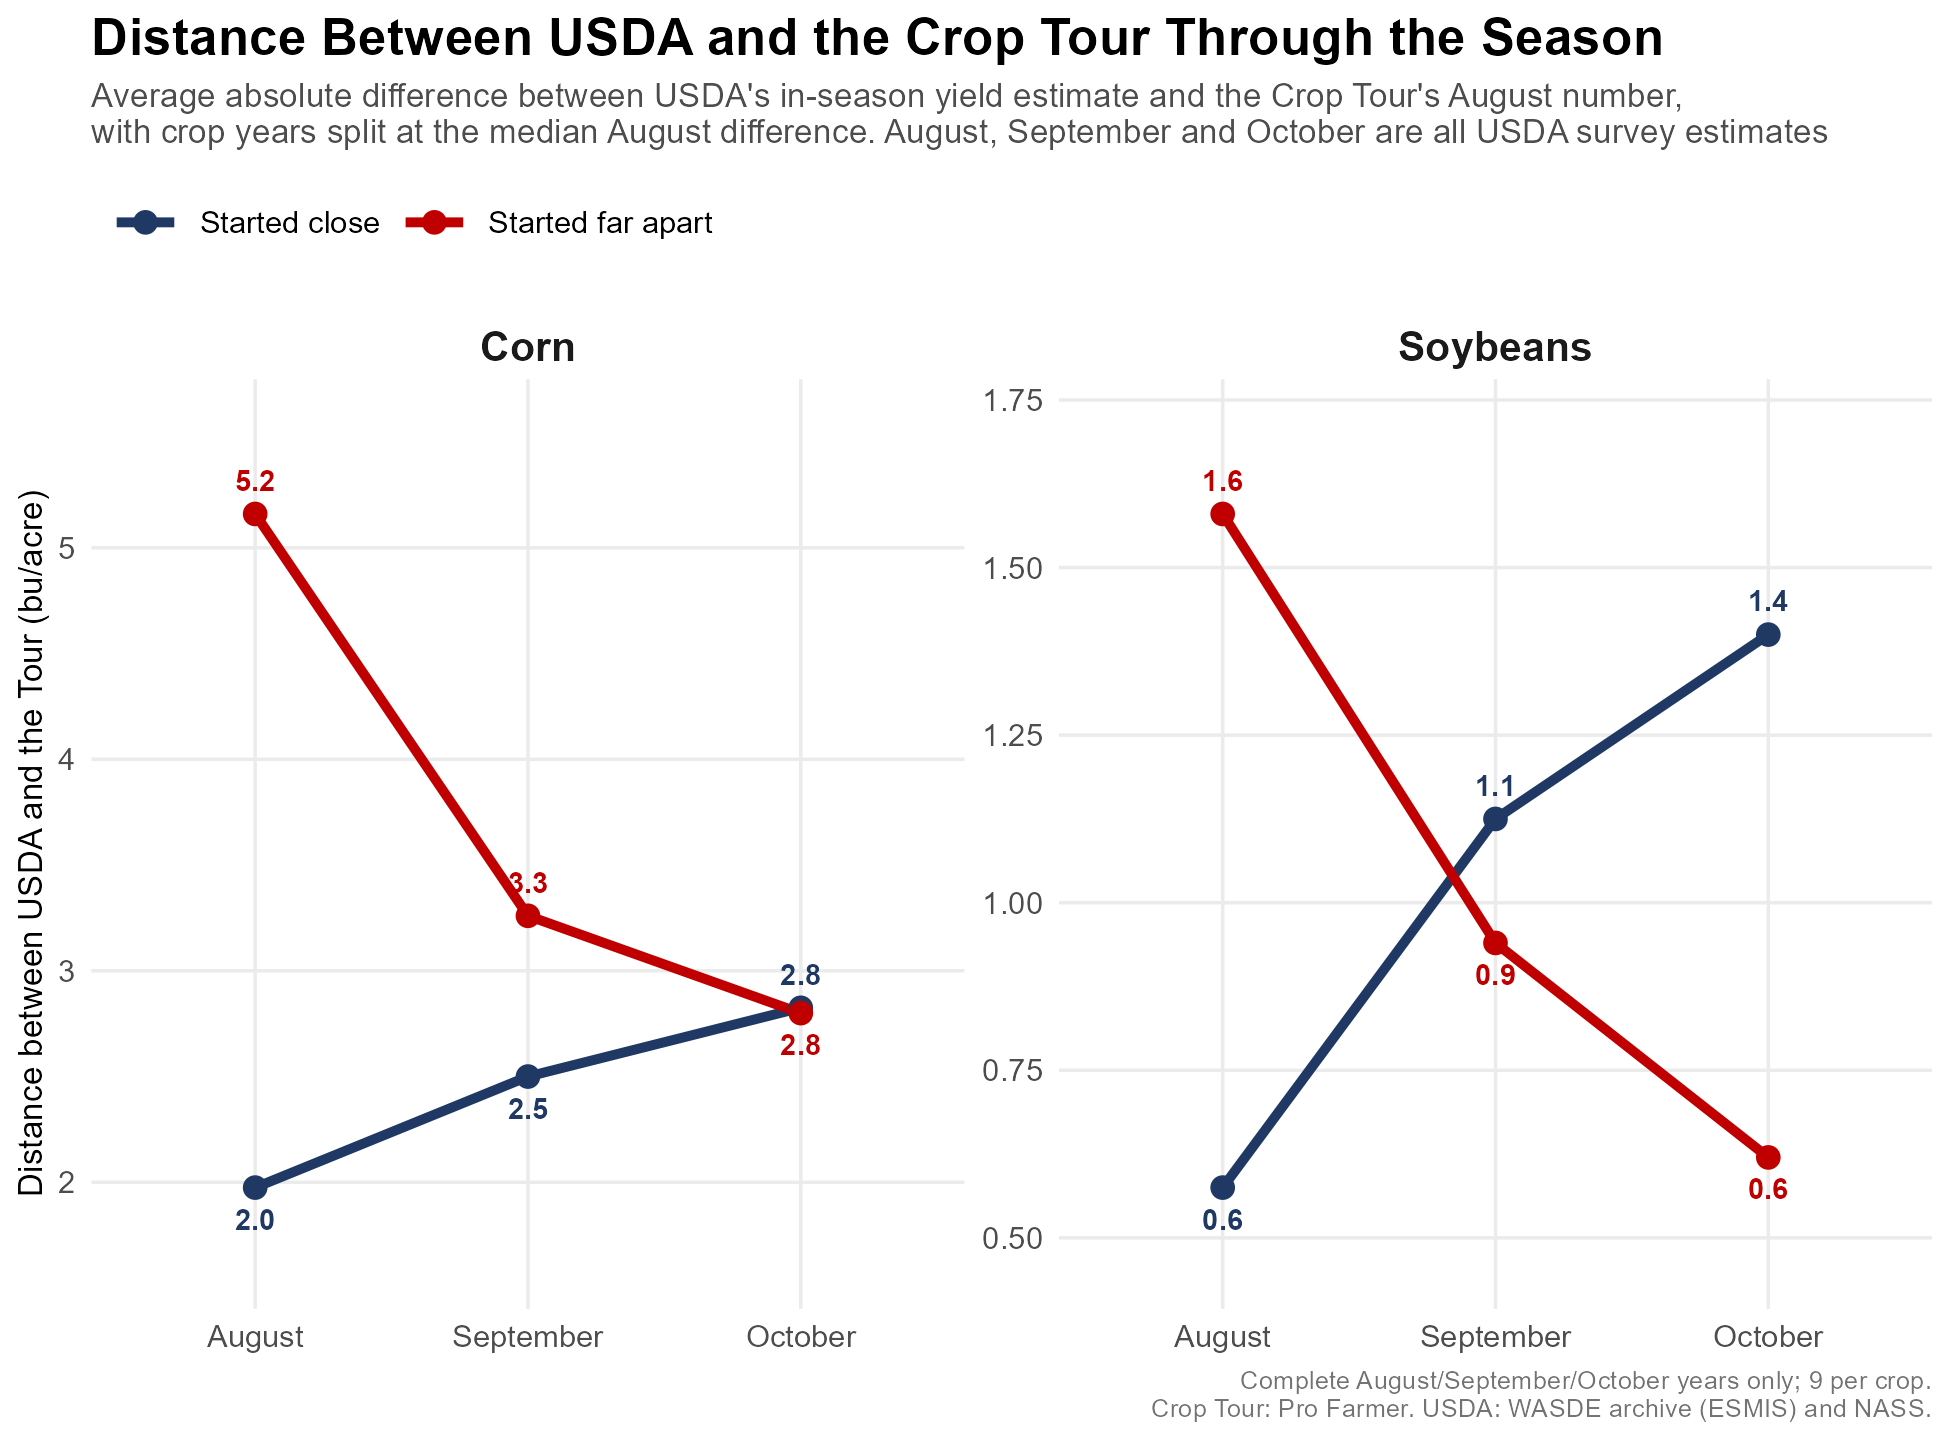
Figure 2 shows how far apart the two yield estimates sit as the season progresses. Crop years from 2016 through 2025 are split into two groups based on how far the Pro Farmer estimate landed from the August WASDE. Blue marks the years the two started close together, red the years they started far apart. The pattern is the same in both crops. Wherever the two estimates start, they end up in a similar place by October. On corn, the gap narrows from 5.2 bushels to 2.8 in the years that started far apart, while the years that started close widen from 2.0 to 2.8. The two groups land on the same number. On soybeans, they go further and trade places entirely, with the wide years closing from 1.6 to 0.6 and the close years opening from 0.6 to 1.4.
The practical point is that the size of the August disagreement does not tell you much about what follows. A loud year and a quiet year arrive at about the same distance by October. That is worth keeping in mind this fall, because the 7.5 bushel corn gap between the Tour and the August WASDE is the widest in this sample, and the history here does not support reading that width as a forecast of how far USDA has to move.
The Crop Tour is better read as direction than level. It has come in below the August WASDE on corn in nine of the last ten years by an average of 3.5 bushels, so this year’s 7.5 bushel gap is closer to four bushels of real news, and USDA’s own August number has been the more accurate of the two against the final. On soybeans, there is no yield story at all, since the Tour landed slightly above USDA. The September Crop Production report is the first chance for USDA to move with new survey data behind it. Producers pricing into this rally should know that part of it rests on an estimate history says overstates the corn shortfall.
Figure 1. Average Pro Farmer Crop Tour August yield estimate minus the USDA yield, 2016 through 2025, measured against the August, September, and October WASDE and the final yield. Negative values indicate the Crop Tour was lower. The October average excludes the 2025 crop year, when the Crop Production and WASDE reports were canceled during the federal government shutdown.
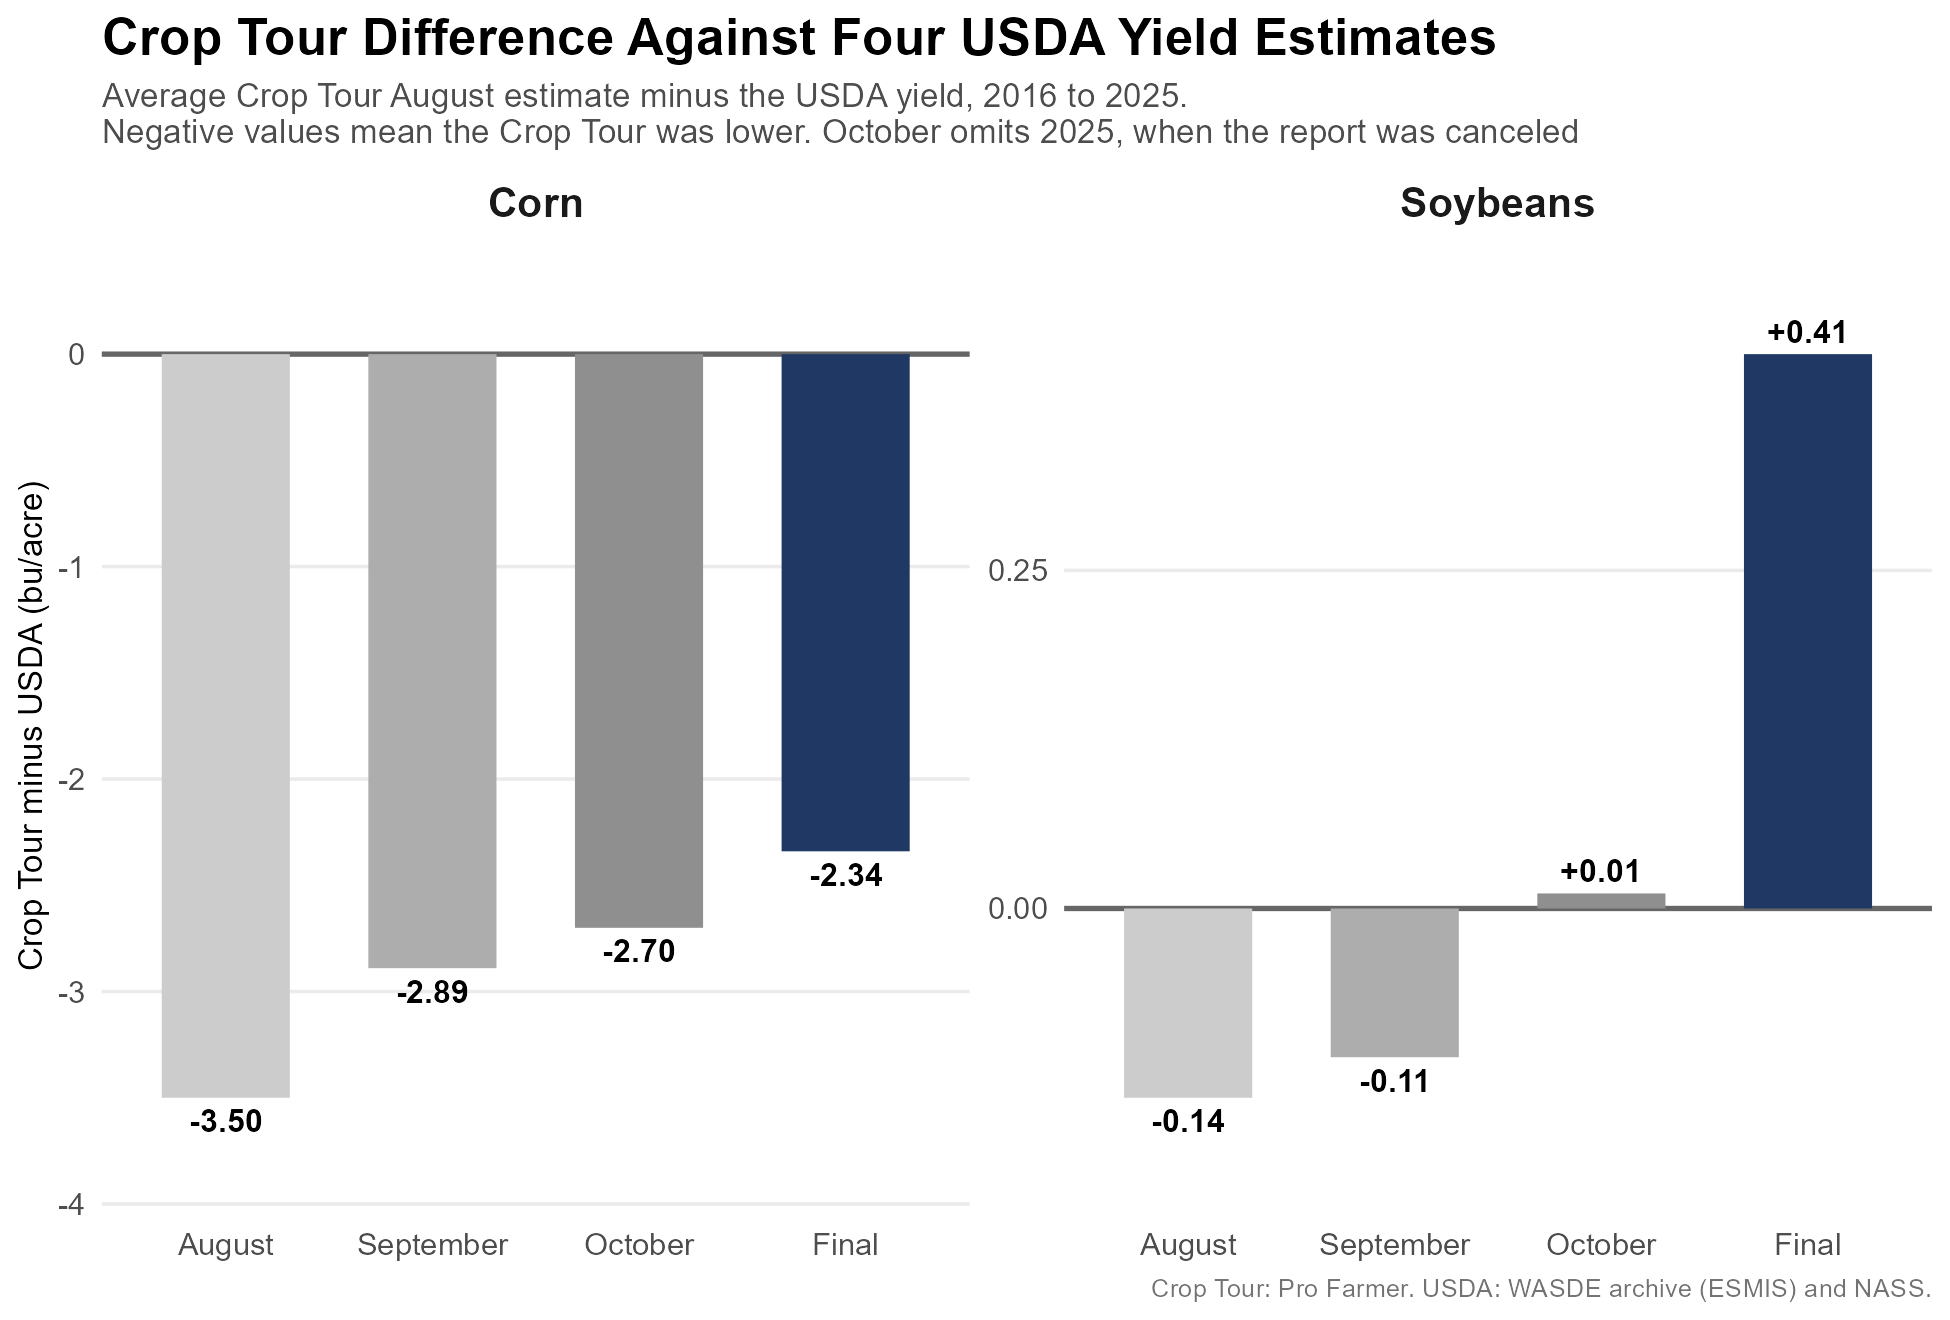
Figure 2. Average absolute difference between USDA’s in-season yield estimate and the Pro Farmer Crop Tour’s August estimate, with crop years split at the median August difference. Complete August, September, and October years only, nine per crop.
References
Gardner, Grant. “July 2026 WASDE: Acreage Moves in July, Yields Move in August.” Southern Ag Today, July 15, 2026. https://southernagtoday.org/2026/07/15/july-2026-wasde-acreage-moves-in-july-yields-move-in-august/
Pro Farmer. “2026 Pro Farmer Crop Tour.” Pro Farmer, August 22, 2026. https://www.profarmer.com/pro-farmer-crop-tour
U.S. Department of Agriculture, National Agricultural Statistics Service (USDA-NASS). “Crop Progress.” August 24, 2026. https://esmis.nal.usda.gov/publication/crop-progress
U.S. Department of Agriculture, World Agricultural Outlook Board (USDA-WAOB). “World Agricultural Supply and Demand Estimates.” August 12, 2026. https://esmis.nal.usda.gov/publication/world-agricultural-supply-and-demand-estimates
Gardner, Grant. “Does a Big Pro Farmer Crop Tour Gap Mean a Big WASDE Yield Change?” Southern Ag Today